Use multiple Docker images on the same ECS service
Node.js app linked to Prometheus app using Docker and ECS
Video version: youtu.be/-rOUt7IDV8I
In this article, we’ll explore how to use the event monitoring and alerting system Prometheus with a Dockerized application running on Amazon Elastic Container Service (ECS). We’ll use the following technologies:
- A Node.js application (based on the official TinyStacks repository)
- A Prometheus application (also available as a TinyStacks repo)
- Docker to create images from both of the applications
- Amazon Web Services ECS (Elastic Container Service)
Here’s what you’ll need
Git, Docker, and the AWS CLI installed locally An active AWS account
Not familiar with Docker? Check out my article and video on launching a simple Hello World Express app with Docker for everything you need to know!
Node.js
Node is a back-end JavaScript runtime environment. It executes JavaScript code on a computer, such as your dev desktop or a Web server.
The good news is that, because you have Docker, you don't actually need to install Node.js. In this walkthrough, we’ll use the Node container image for Docker. This ensures that we avoid version conflicts between the version of Node installed on my machine and yours. It also prevents conflicts during the evolution of the application in production.
Prometheus
Prometheus is a free software application used for event monitoring and alerting. It records real-time metrics in a time series database built using a HTTP pull model, with flexible queries and real-time alerting.
Steps
Here’s what we’ll be doing today to achieve our goal:
- Clone the aws-docker-template-express GitHub Repositorygithub.com/gaiaslastlaugh/aws-docker-templa.. and switch branches
- Build the Node.js image with Docker
- Create an ECR repository for our Node.js App
- Tag and push the Node.js app image
- Create the Node.js service using ECS
- Test the Node.js application
- Clone the node-express-monitoring repository and add Node.js IP in the target
- Build the Prometheus image with Docker
- Create ECR repository for the Prometheus App
- Tag Prometheus image and push it to ECR
- ECS add task definition for service 2
- Change security group inbound rules
- Final Test
Clone aws-docker-template-express GitHub Repository
Go to the AWS Docker Template for Express and clone it from your command line:
git clone https://github.com/tinystacks/aws-docker-templates-express.git
Change into the directory:
cd aws-docker-templates-express
Create a new branch:
git checkout -b prometheus-integration
Open the folder using your favorite IDE. If you use Visual Studio Code, you can type
code .
Our branch now contains the Prometheus client.
Build the Node.js Image with Docker
Now let’s build our Docker image.
docker build -t nodejs-app .


docker images

Create ECR repository for Node.js App
Now let's create an ECR (Elastic Container Registry) repository on AWS to store the images we built. We can easily do this using the AWS CLI. If you need to set up the AWS CLI, check out my instructions in this article.
aws ecr create-repository --repository-name nodejs-app --region us-east-1
Let's check on the AWS Console if the repository has been created correctly:
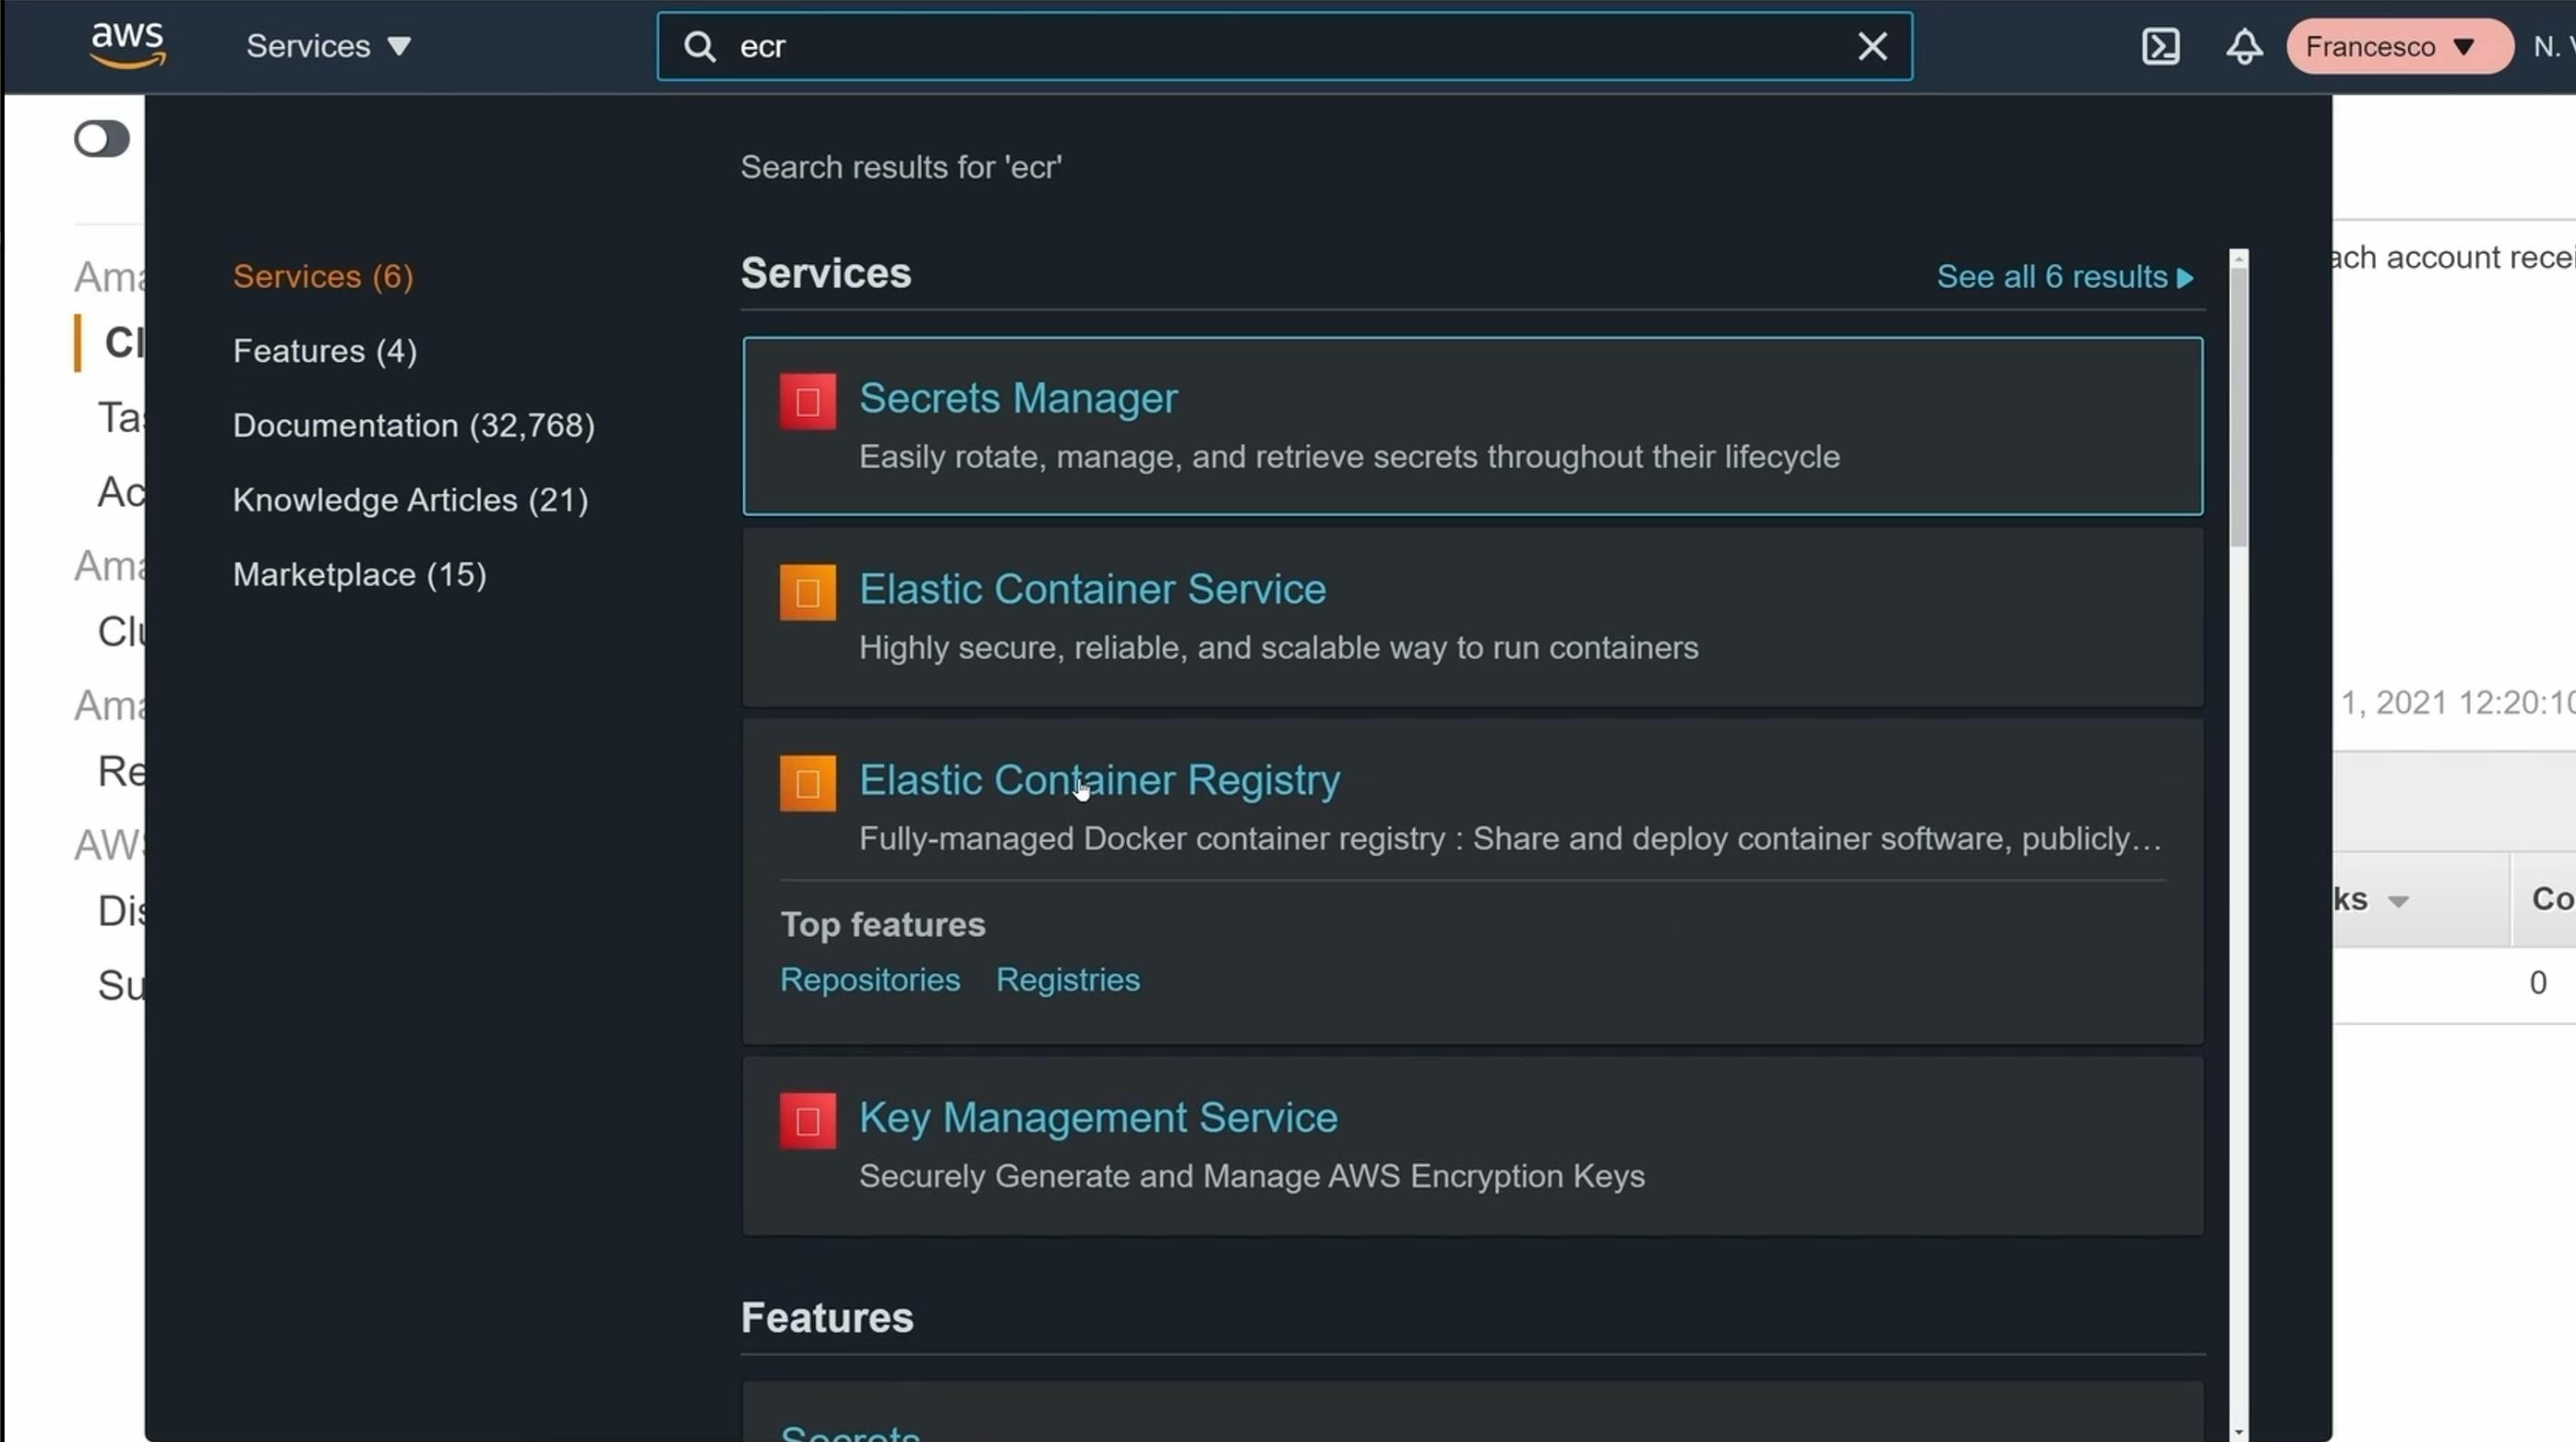
If you see something like this, you’re good to go.

Tag and Push the Node.js app Image
Now let's tag the image using the following command, replacing <ECR_REPO> with your ECR repository URI:
docker tag nodejs-app <ECR_REPO>
Now you can push the image to the existing ECR repository:
docker push <NODEJS_IMAGE>
Create the Node.js Service Using ECS
On the AWS Console, look for ECS (Elastic Container Service):

Let's create a new task. On Container Definition, click Custom:
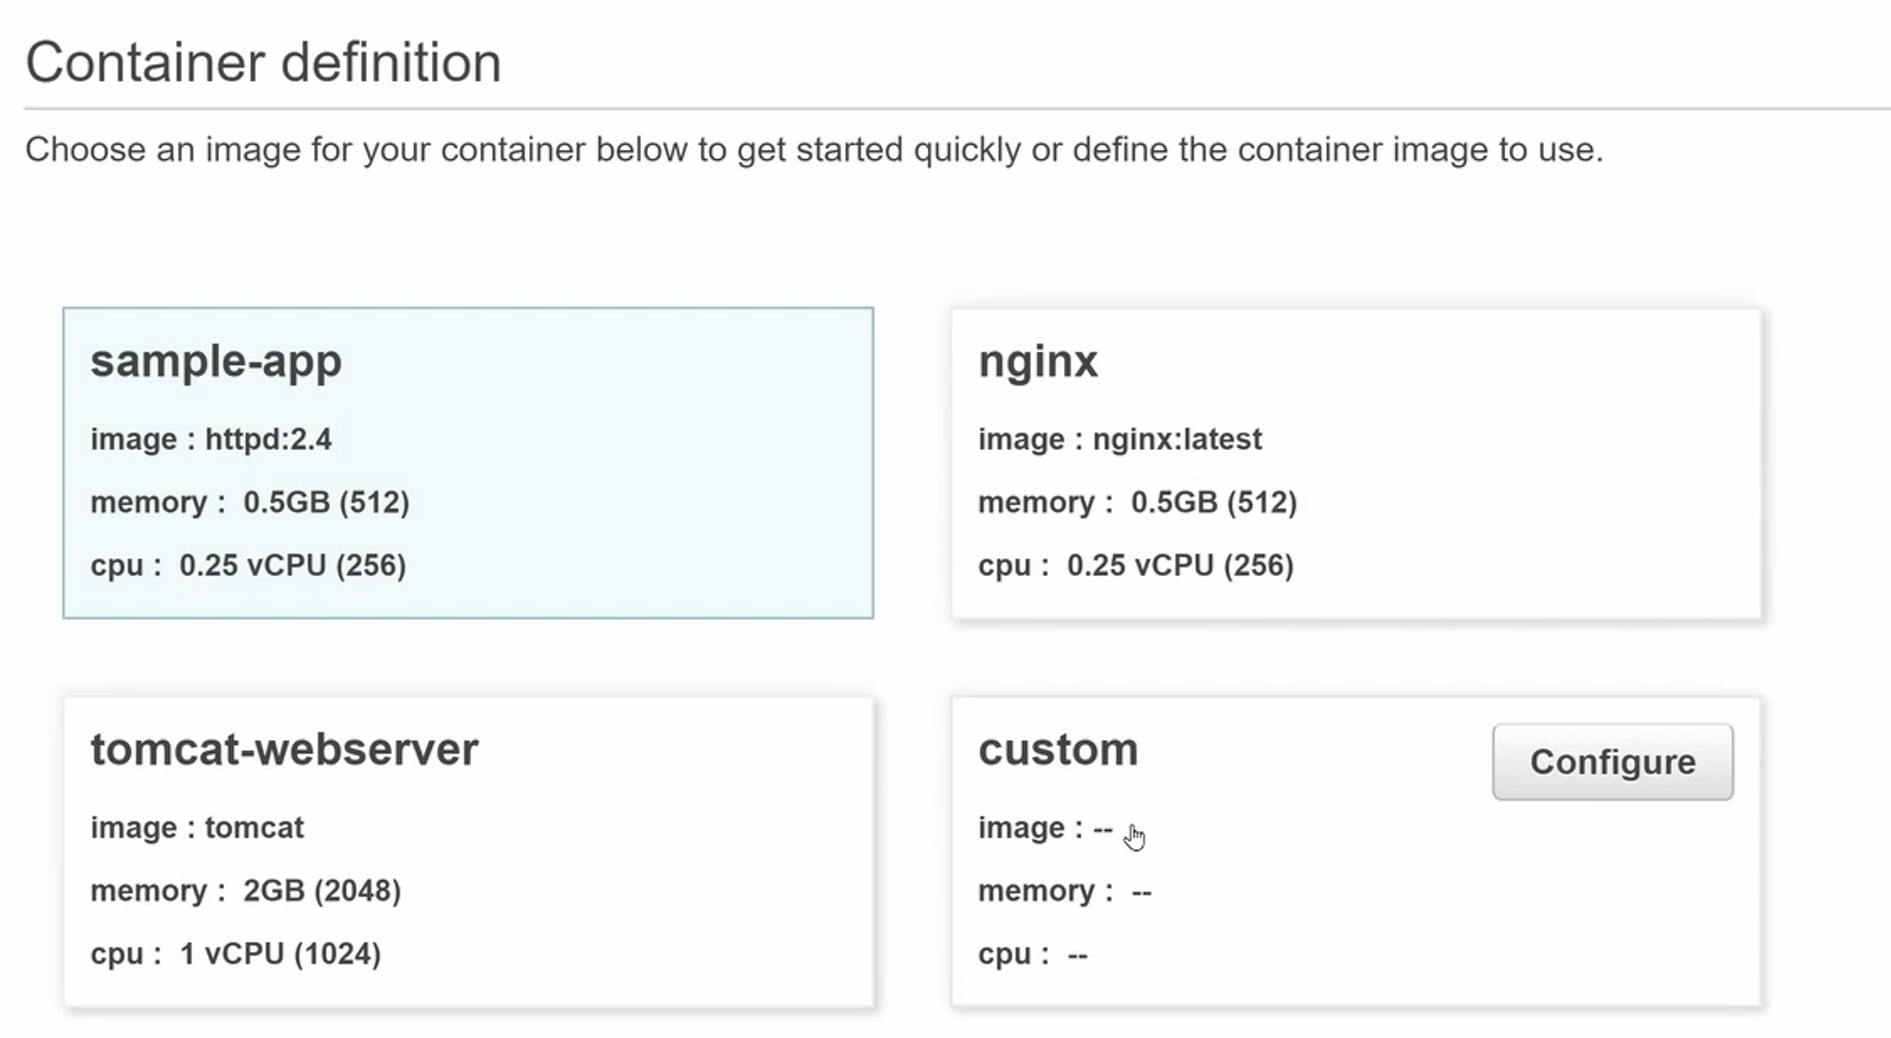
Here we just need to define 3 things:
- Container name: use
nodejs-app - Image: The image in the ECR repository
- Port: 8080
Container name and image:
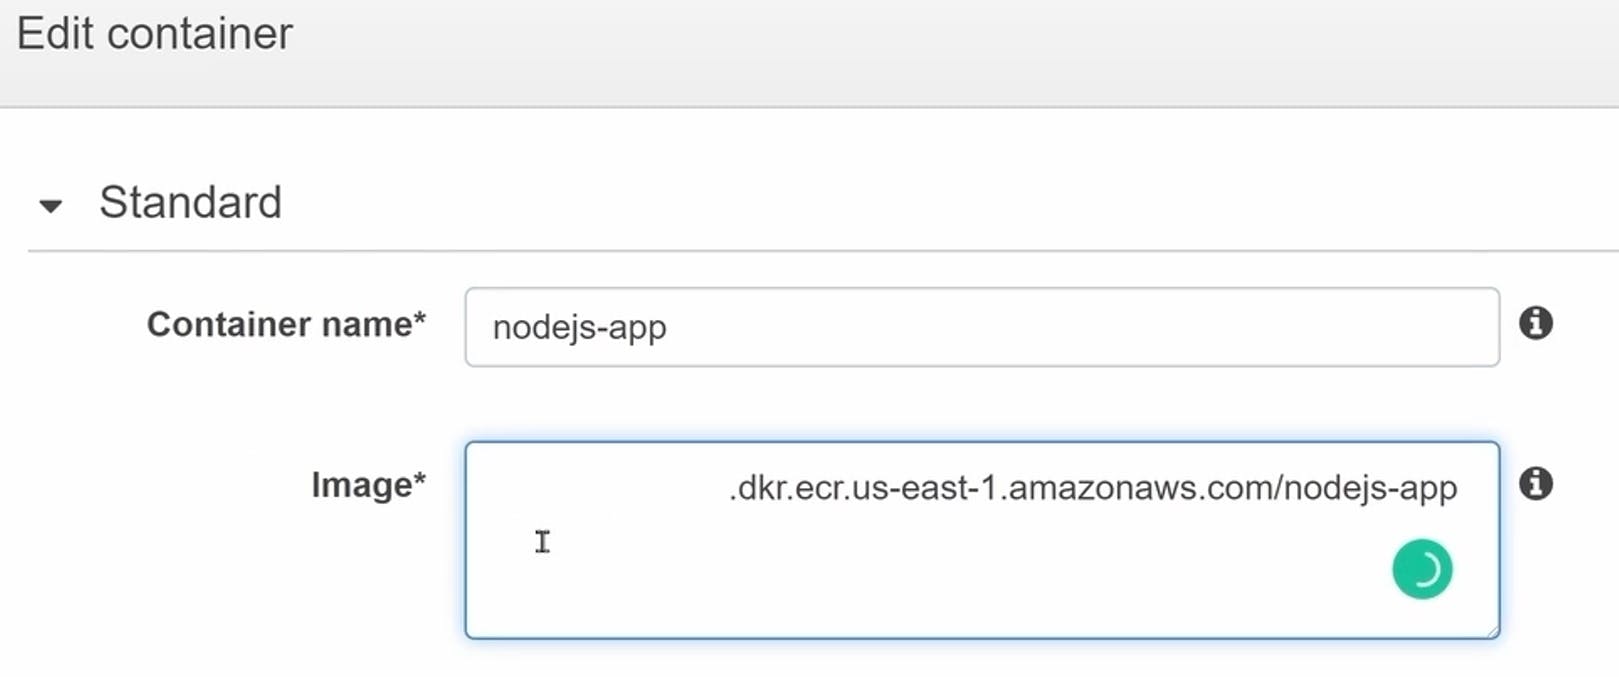
Port mapping:

For this next step and for the service definition, you can click Next.
For the cluster, you can define a custom name - for example, prom-node:
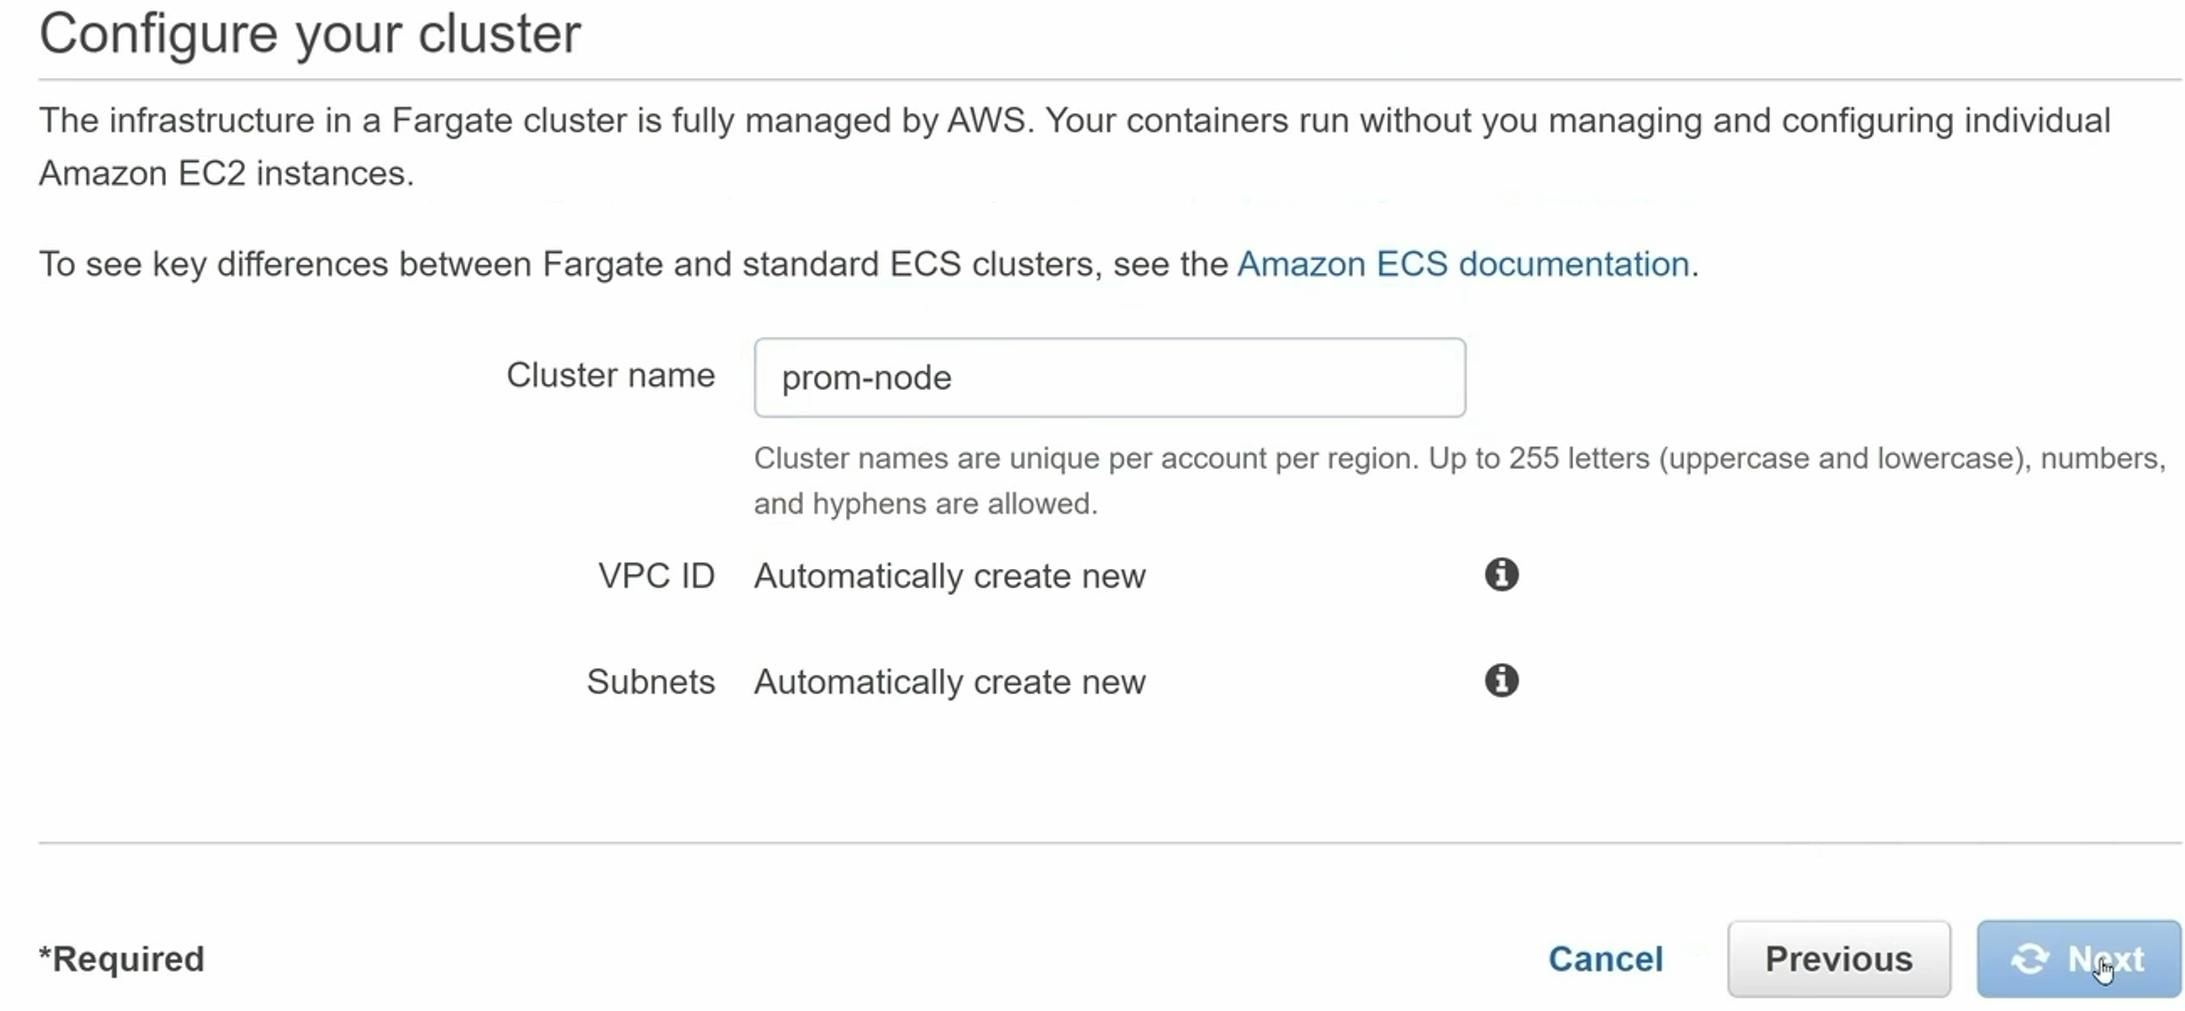
Click Next,Finally, click Create:
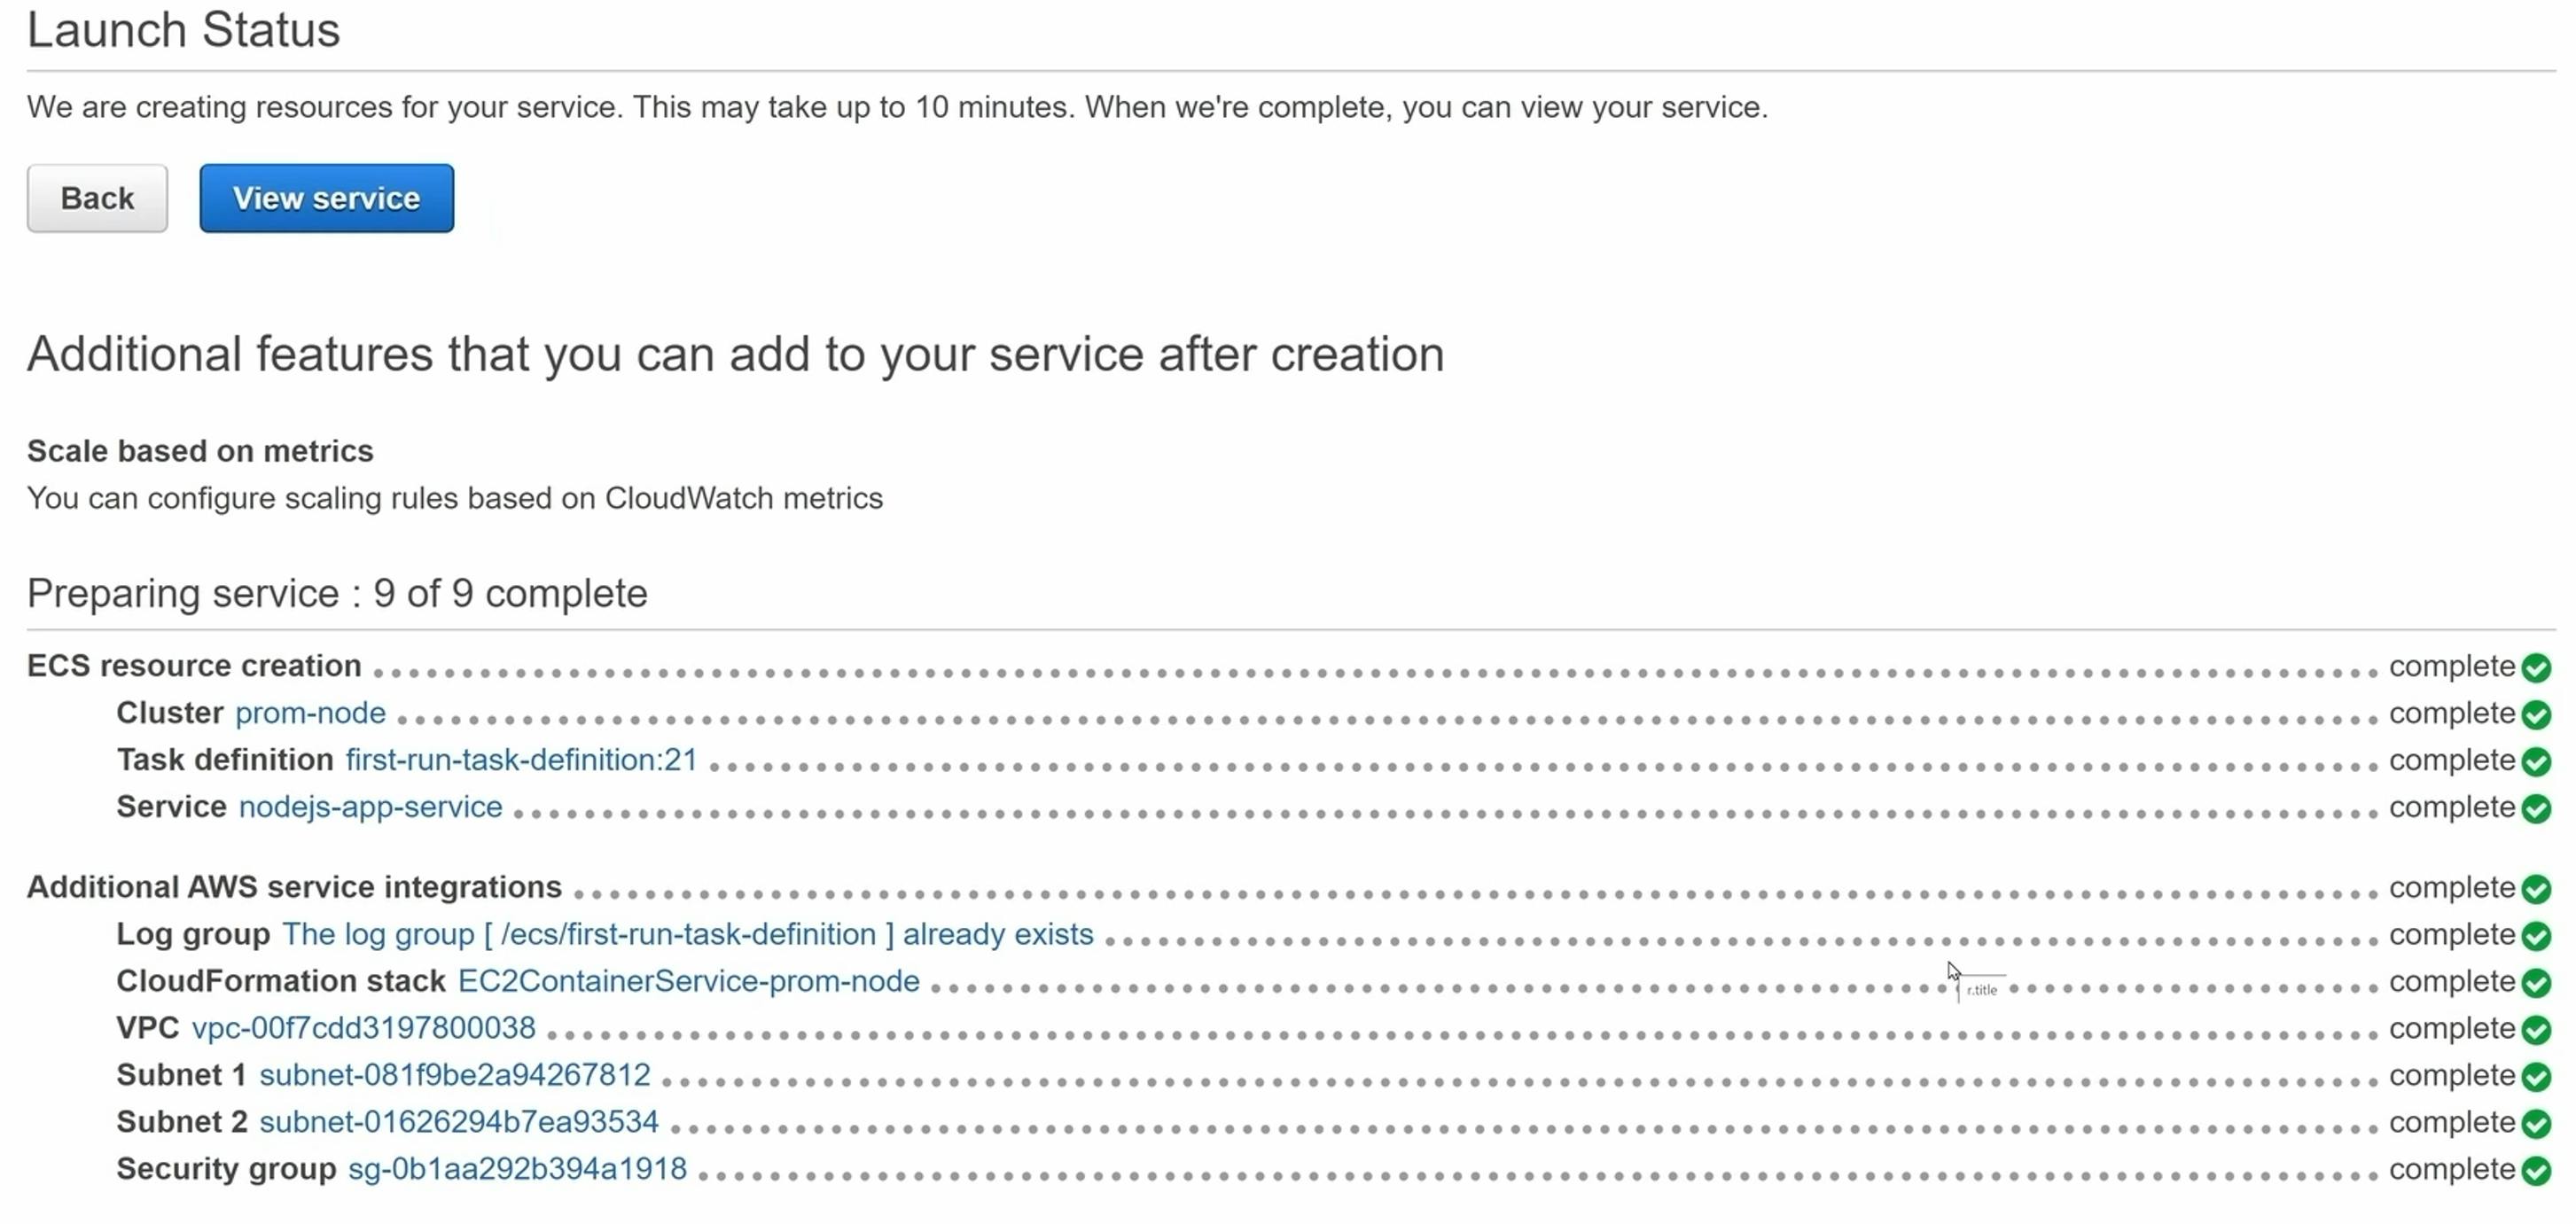
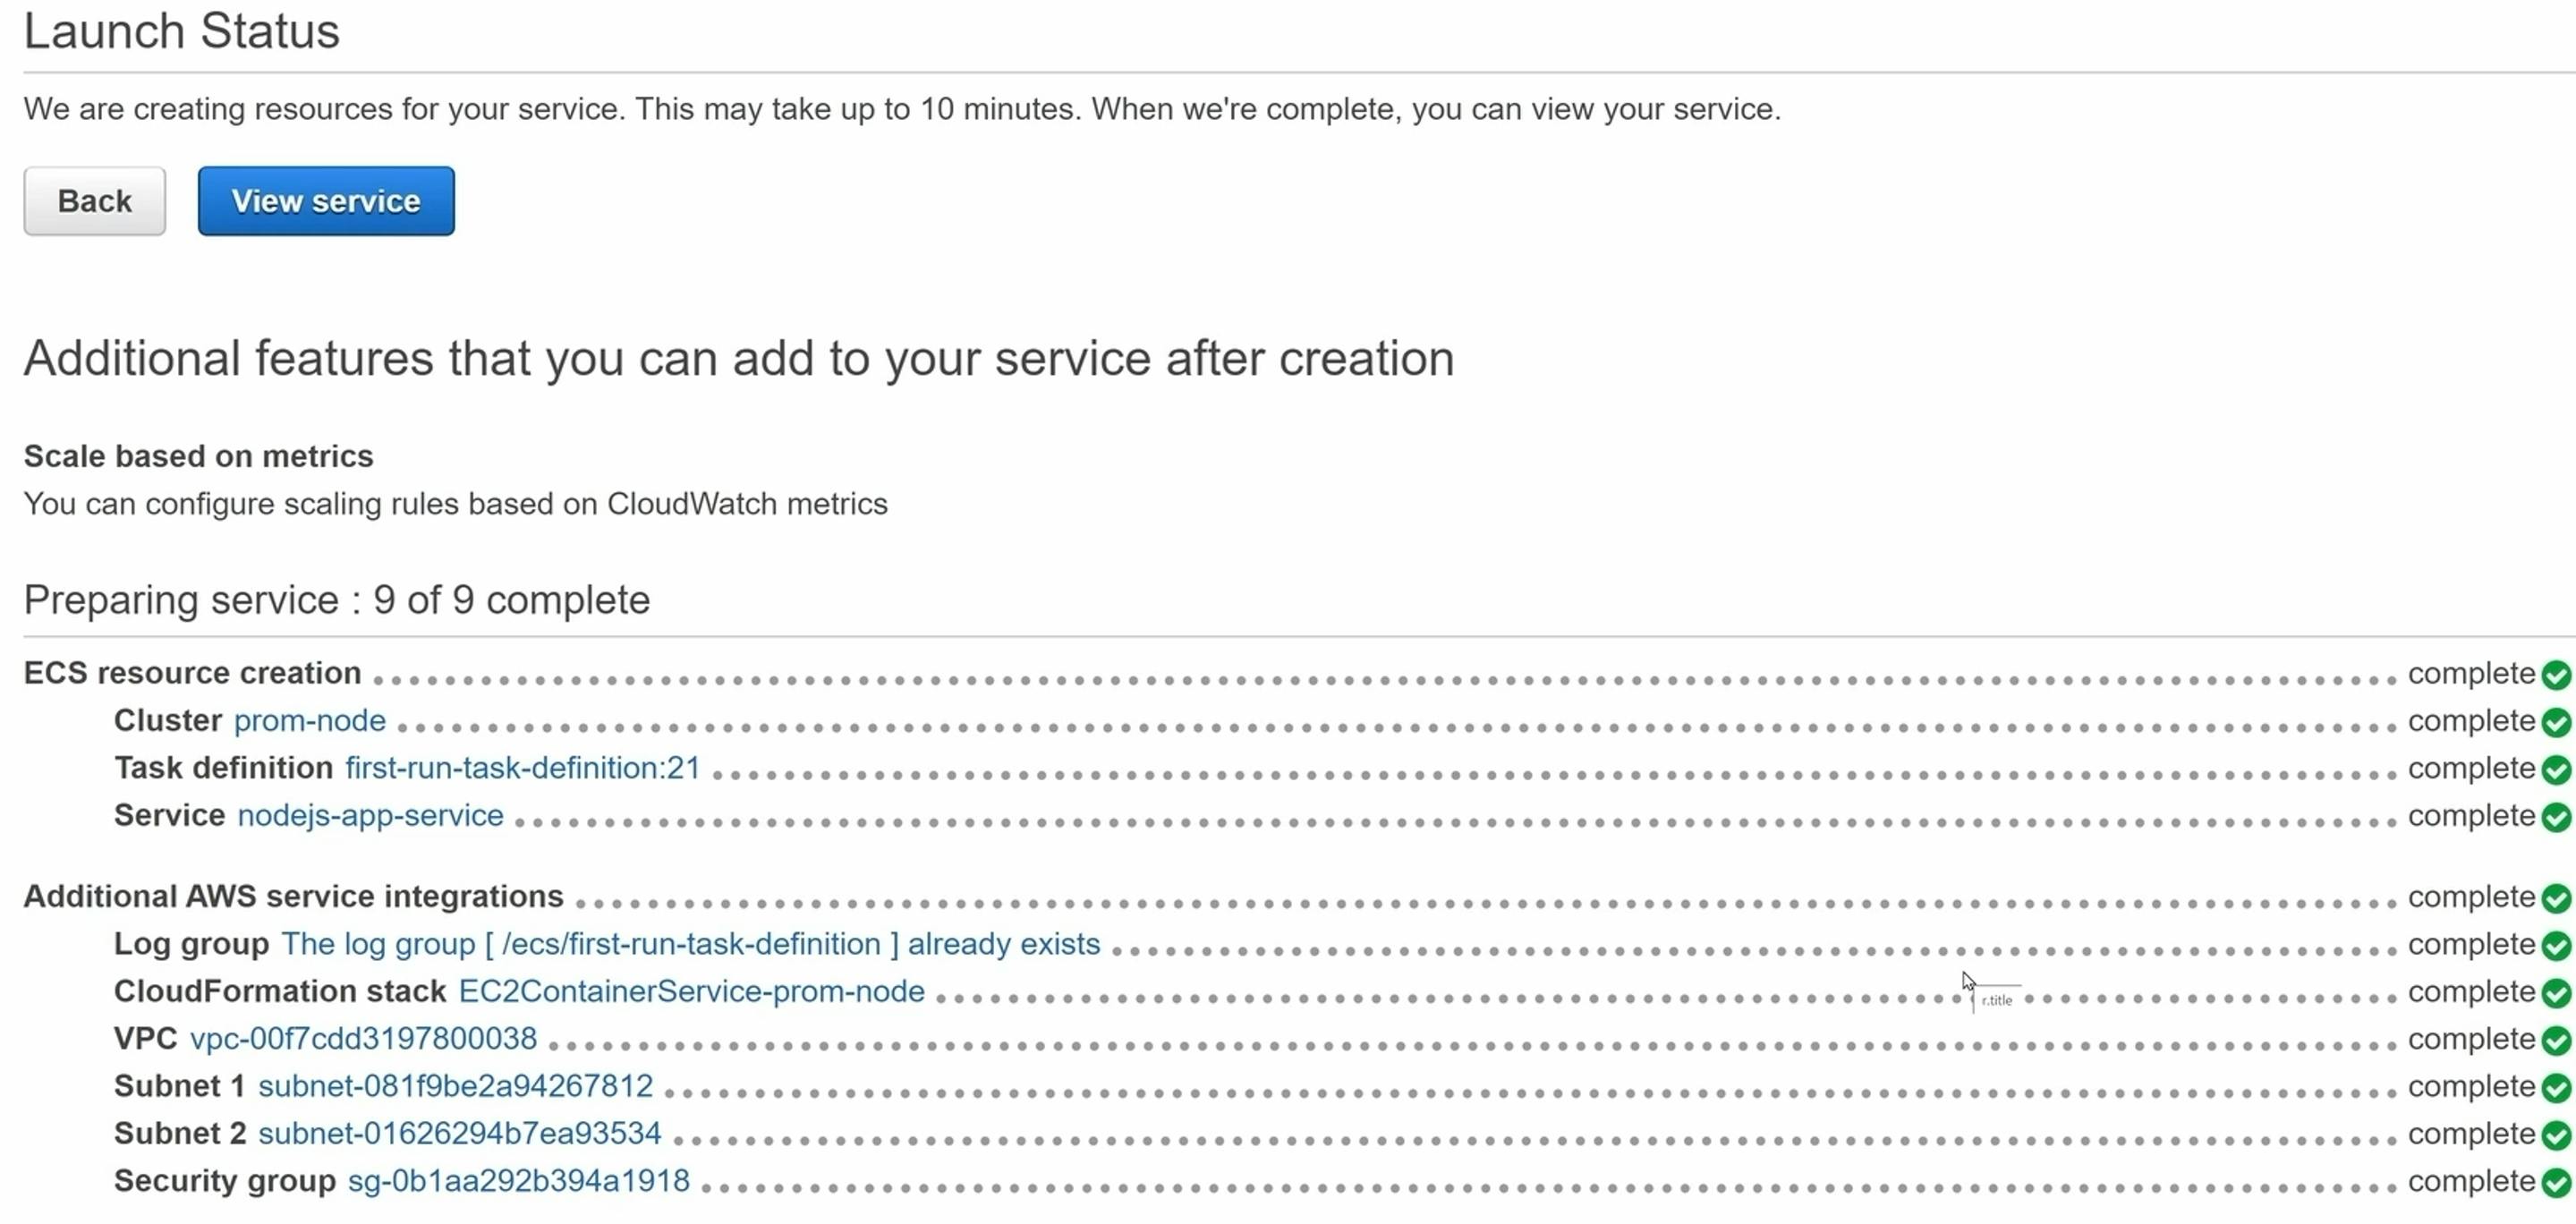
Now we need to wait a couple of minutes, until the cluster, the service, and the task are up and running.
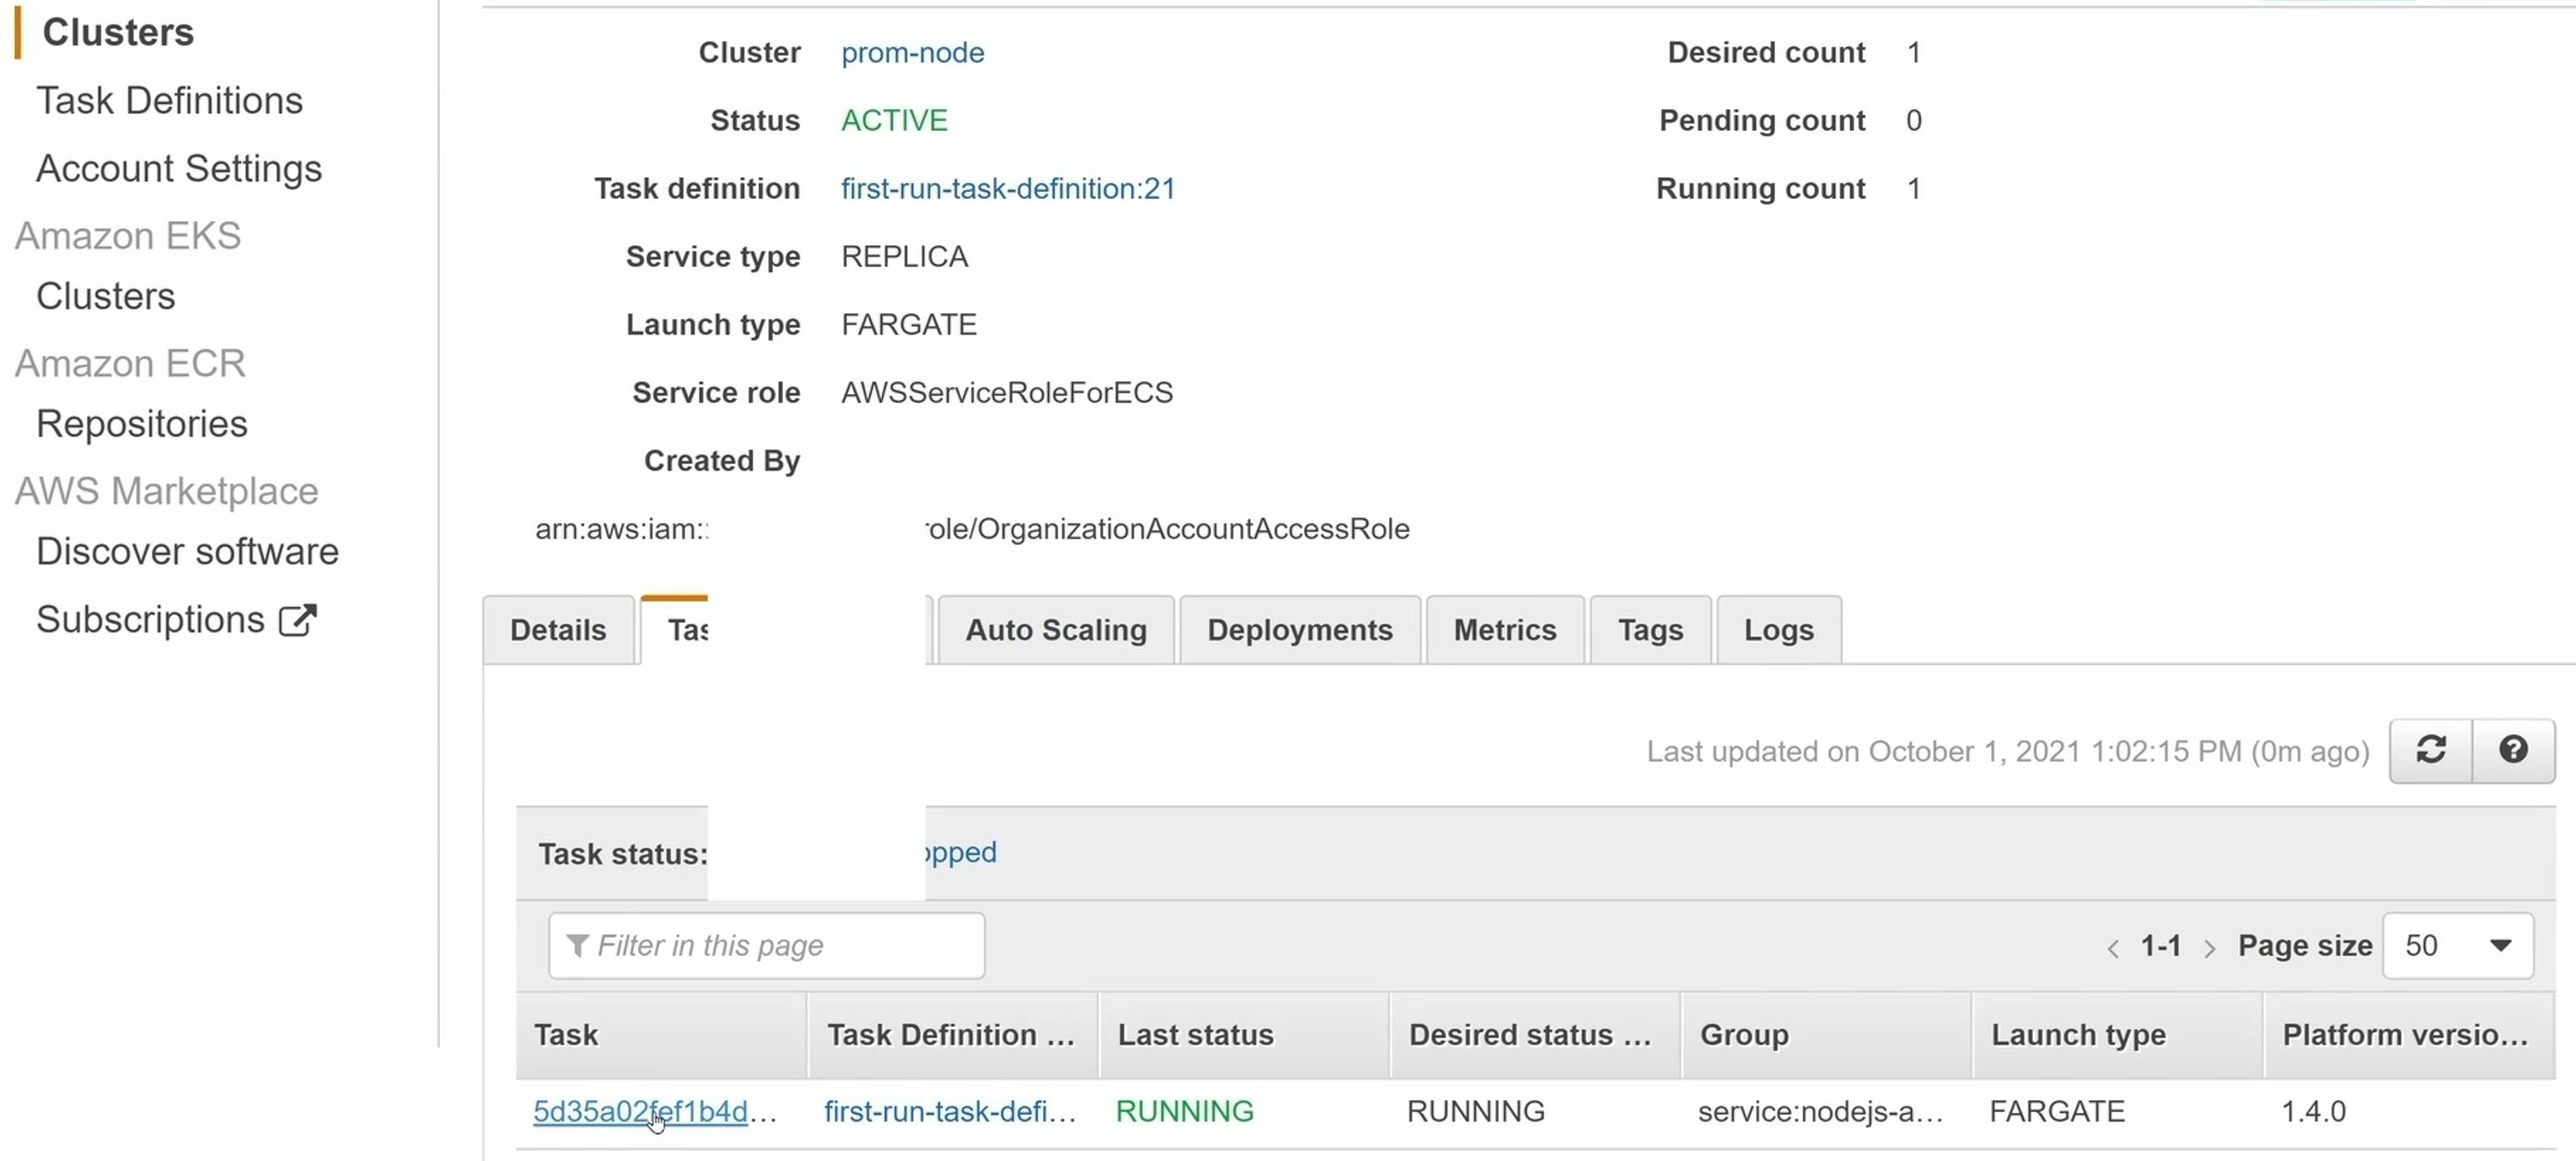
Go to Tasks and wait until the status is Running (green):
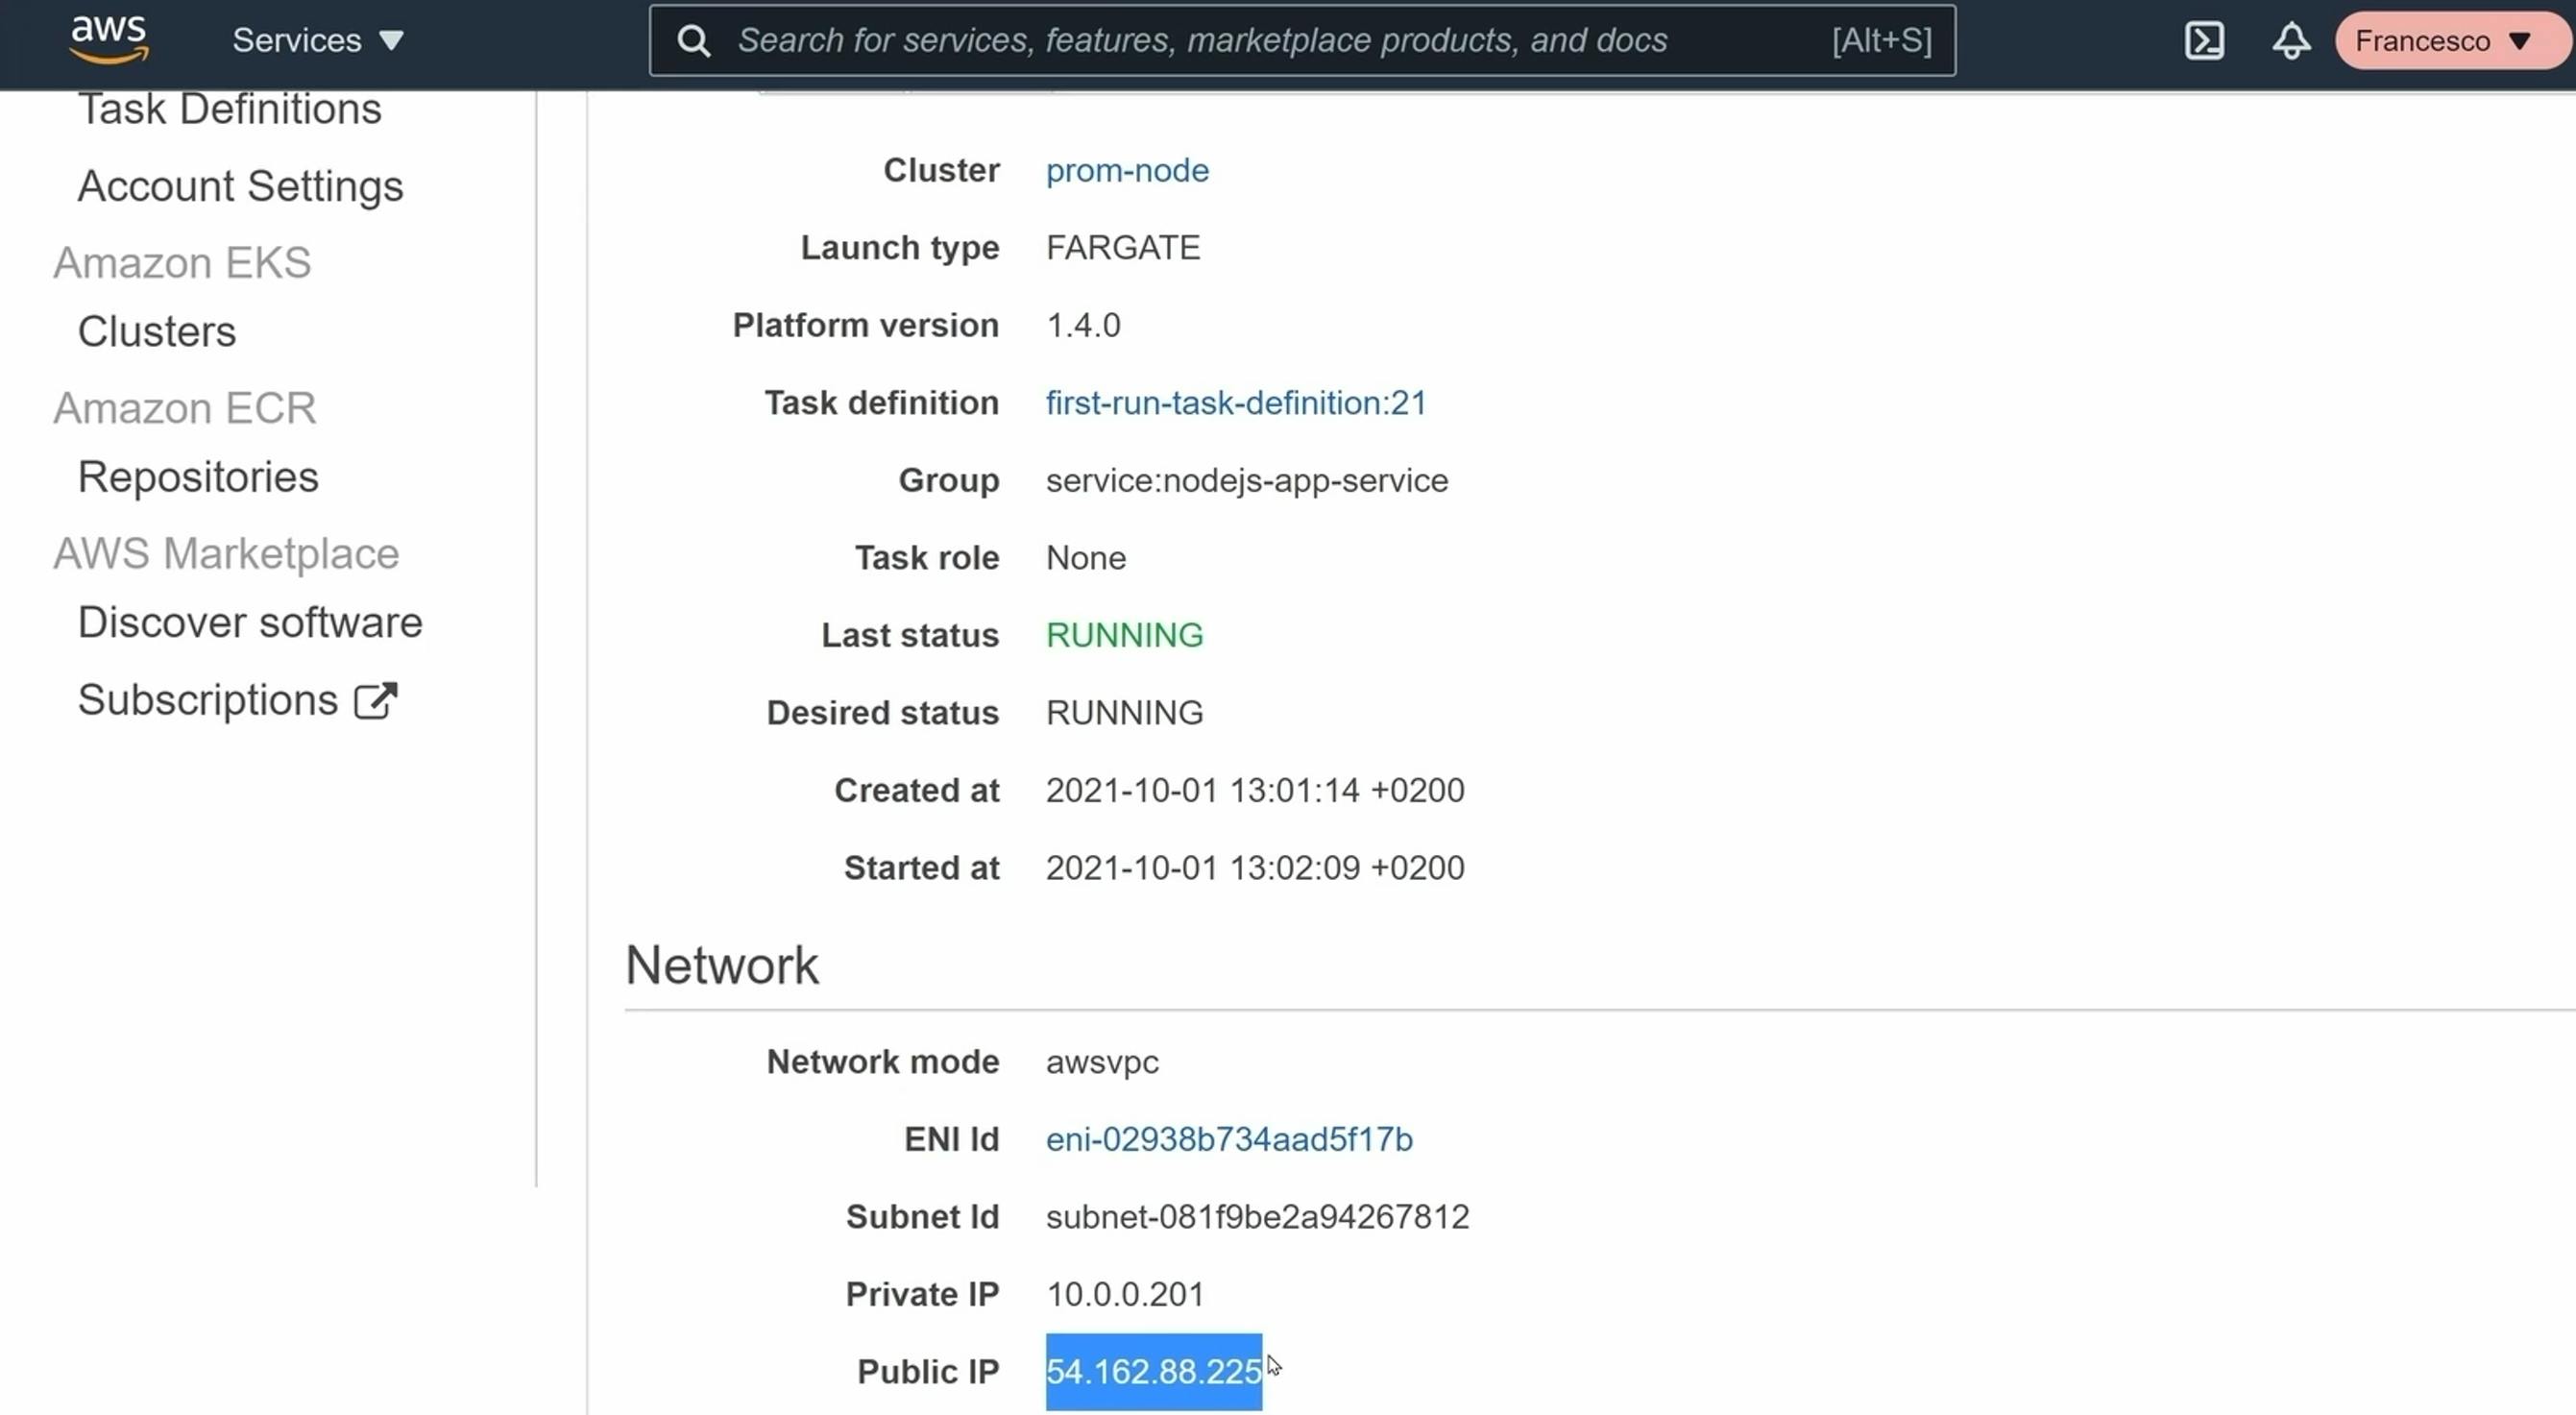
Click on the task (not the task definition) and copy the IP address:
Test the Node.js Application
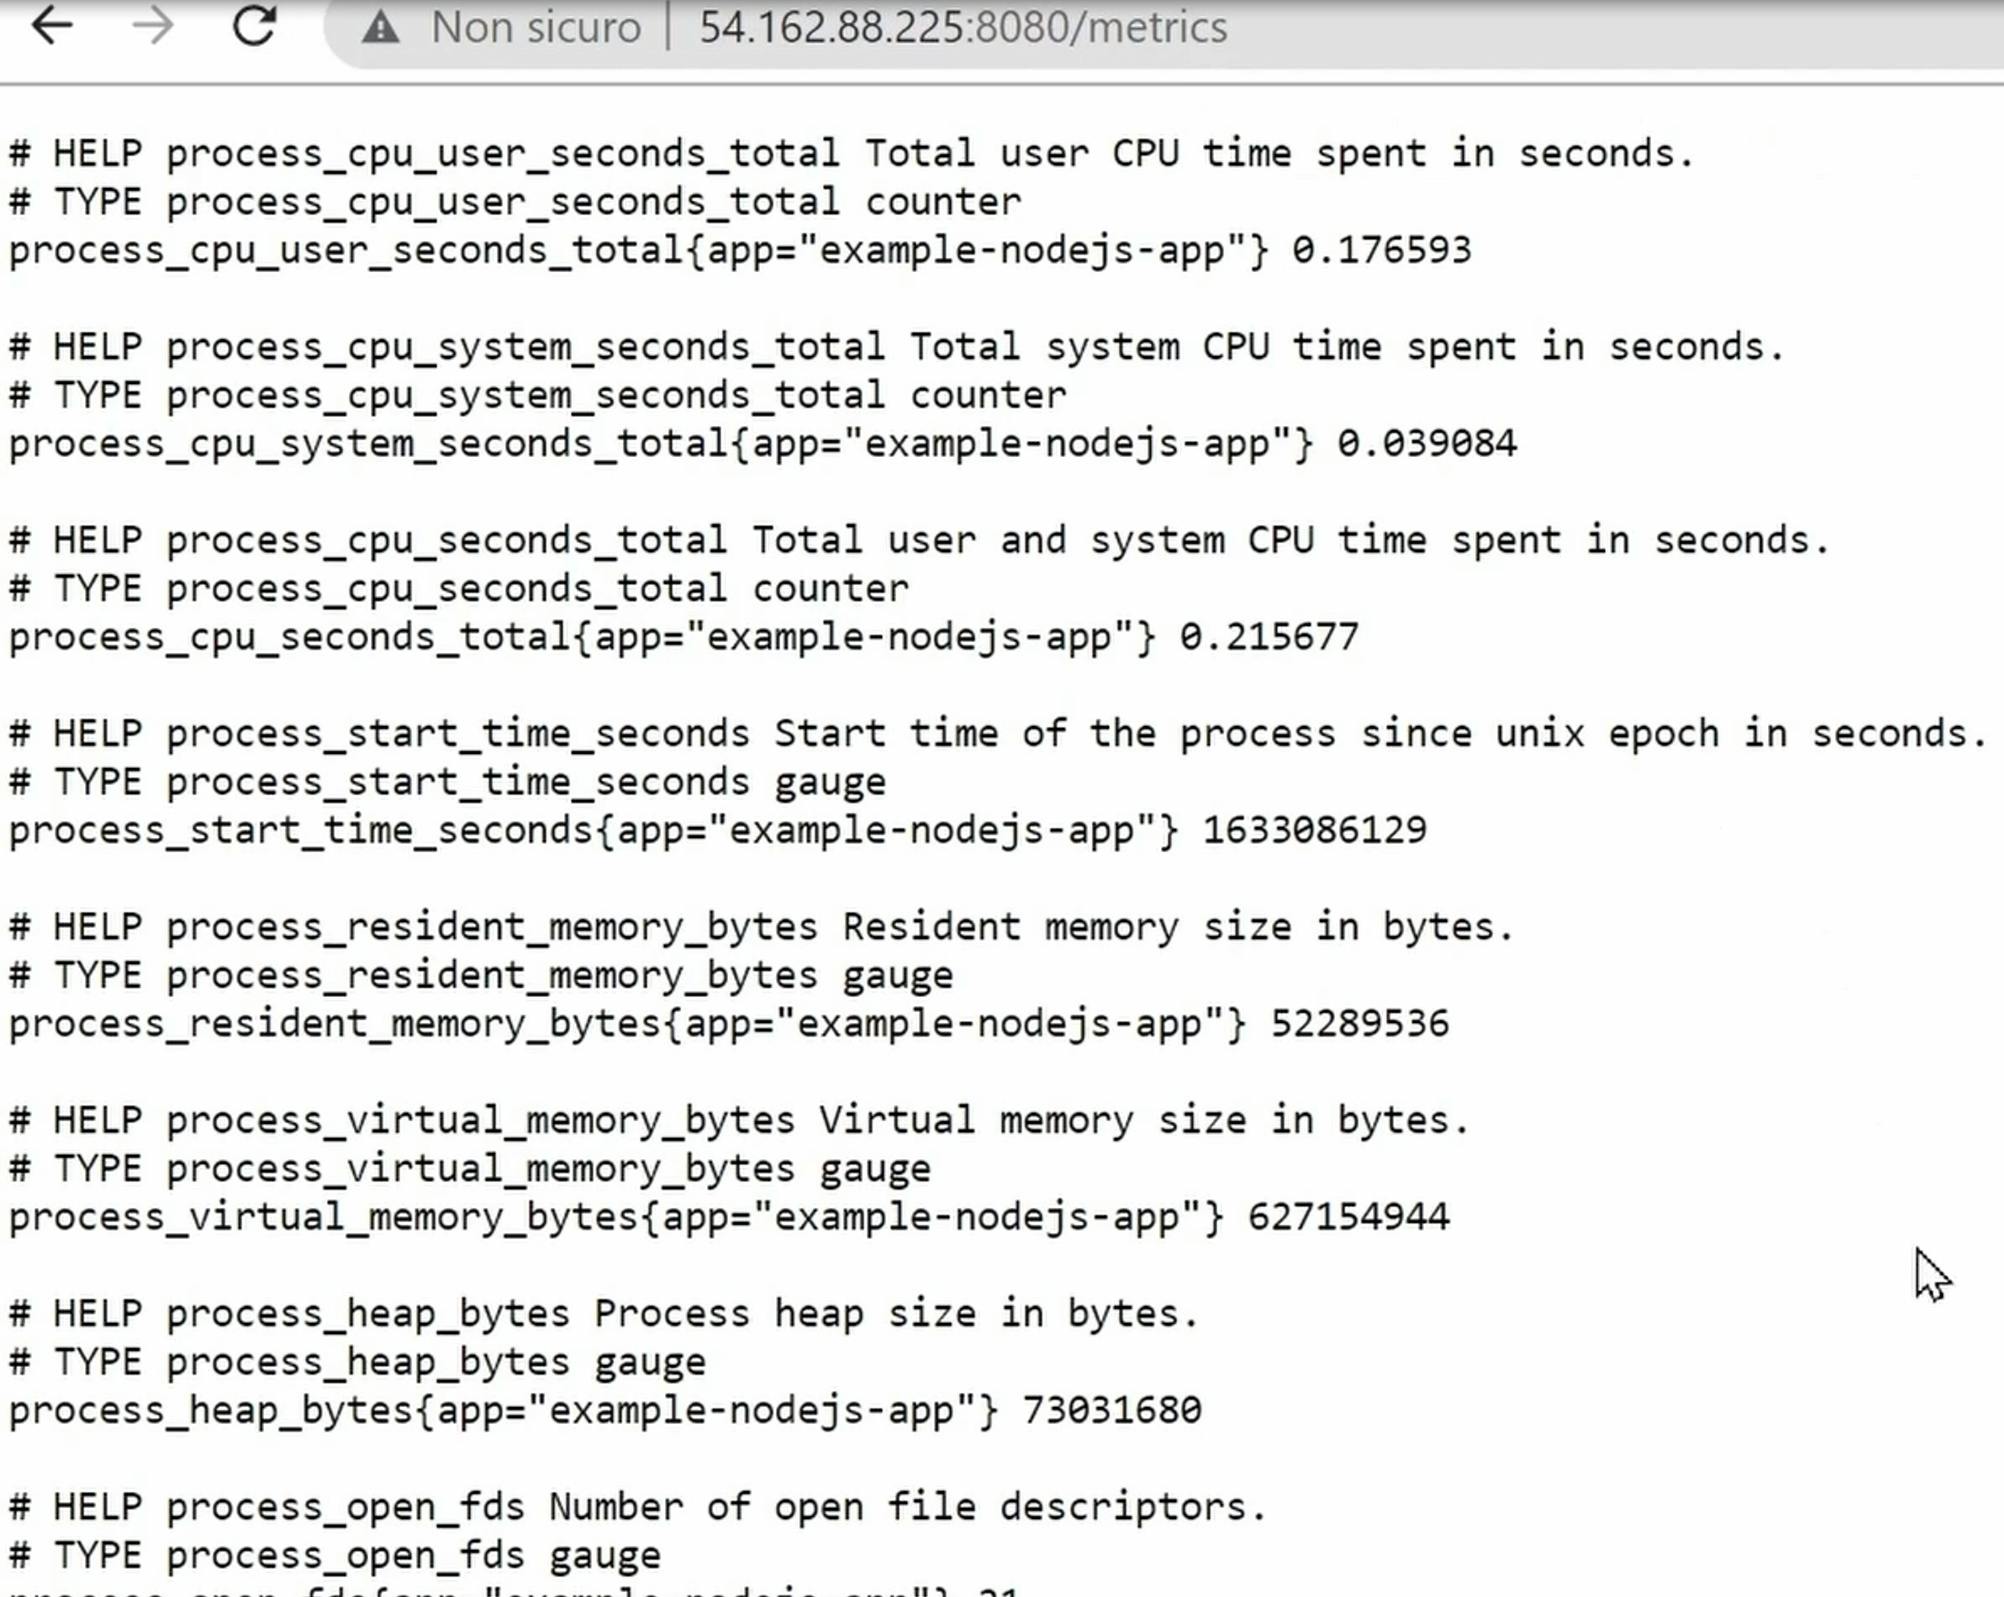
Go on any browser and visit NODEJS_APP_IP:8080/metrics, where NODEJS_APP_IP is the IP we just copied. You’ll see something like this:
Clone the node-express-monitoring Repository
Now let's clone the second repository:
git clone https://github.com/tinystacks/node-express-monitoring.git
Change into the directory:
cd node-express-monitoring
Open the folder with your favorite IDE. For example, if you use Visual Studio Code, type:
code .
Open the prometheus folder. Next, open the prometheus.tml file and replace nodejs-app` with the IP address of your application:
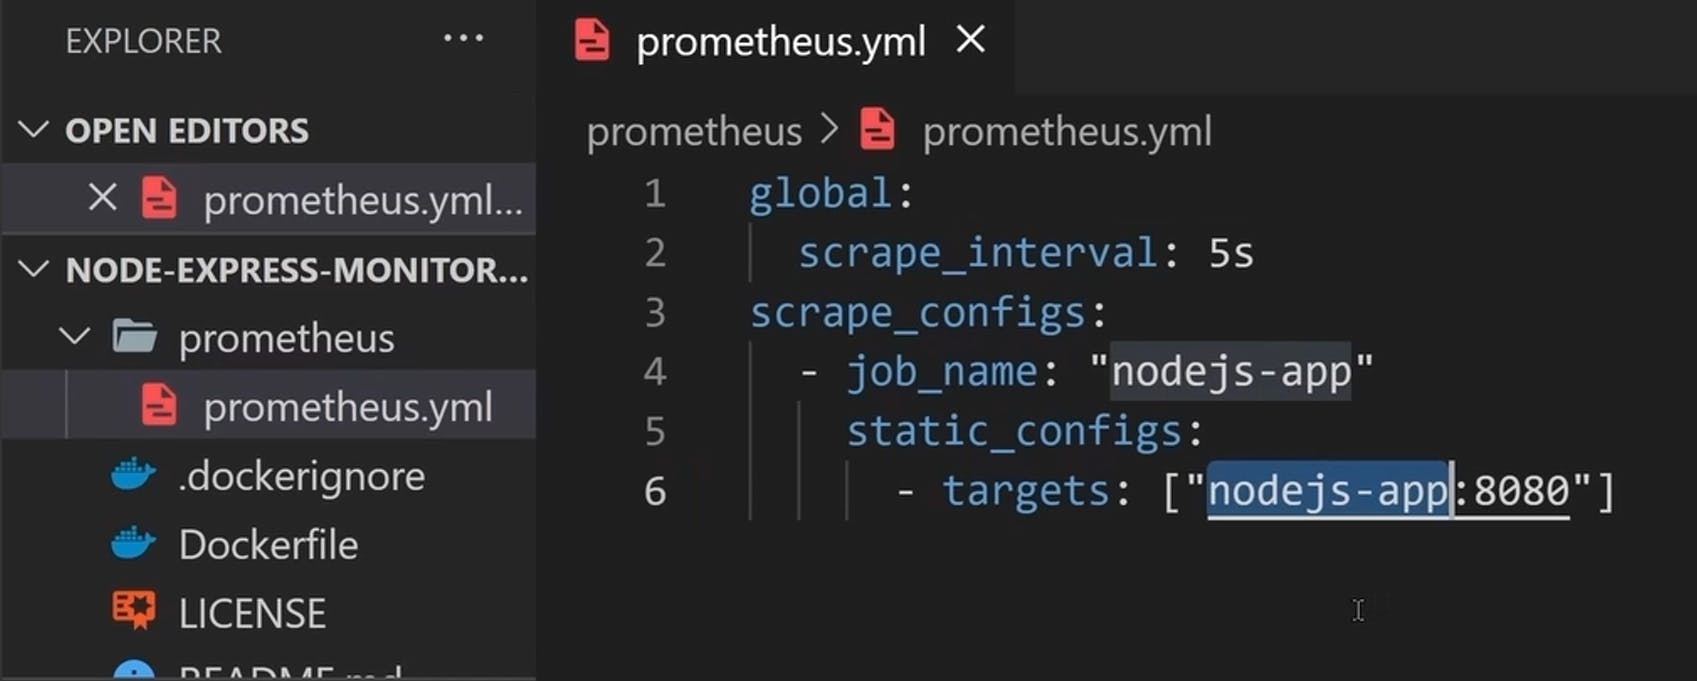
(Note: this is just for demo purposes, not production-ready, as the IP address should be dynamic!)
Build the Prometheus Image with Docker
docker build -t prom .
Create an ECR Repository for Prometheus
aws ecr create-repository --repository-name prom --region us-east-1
Tag Your Prometheus Image and Push to ECR
Let's tag the built image with the new repository. Replace <ECR_REPO> with your ECR repository URI:
docker tag prom <ECR_REPO>
Now you can push this image to the ECR repository:
docker push <PROMETHEUS_IMAGE>
dd Task Definition in ECS for Second Service
On ECS, in the same cluster, create a new task definition for the Prometheus image:
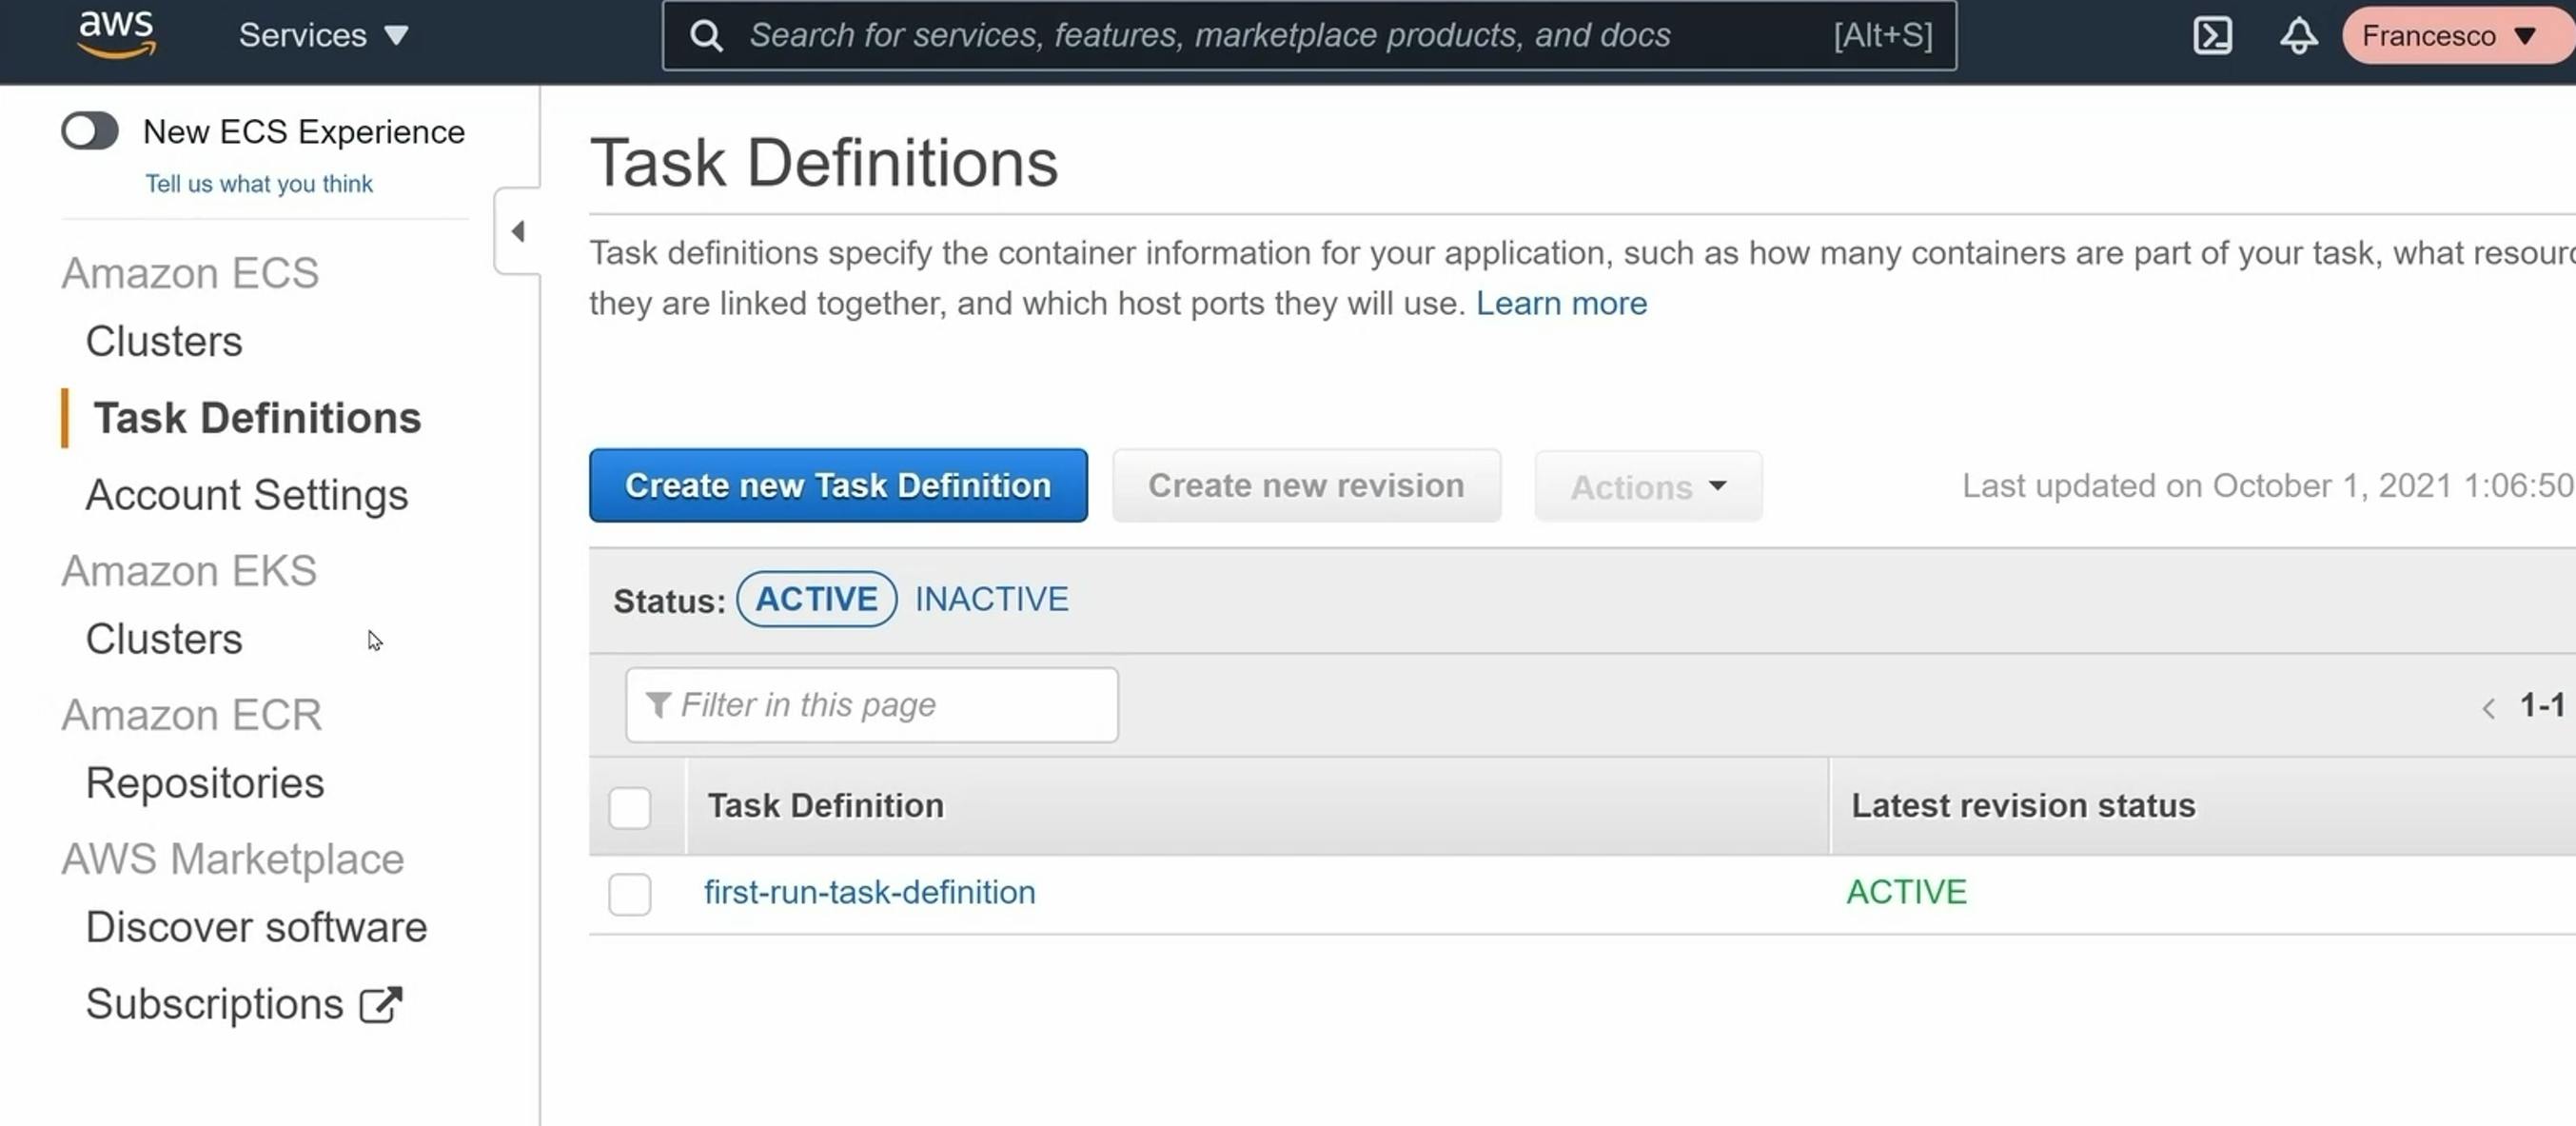
Select FARGATE and click "Next Step"
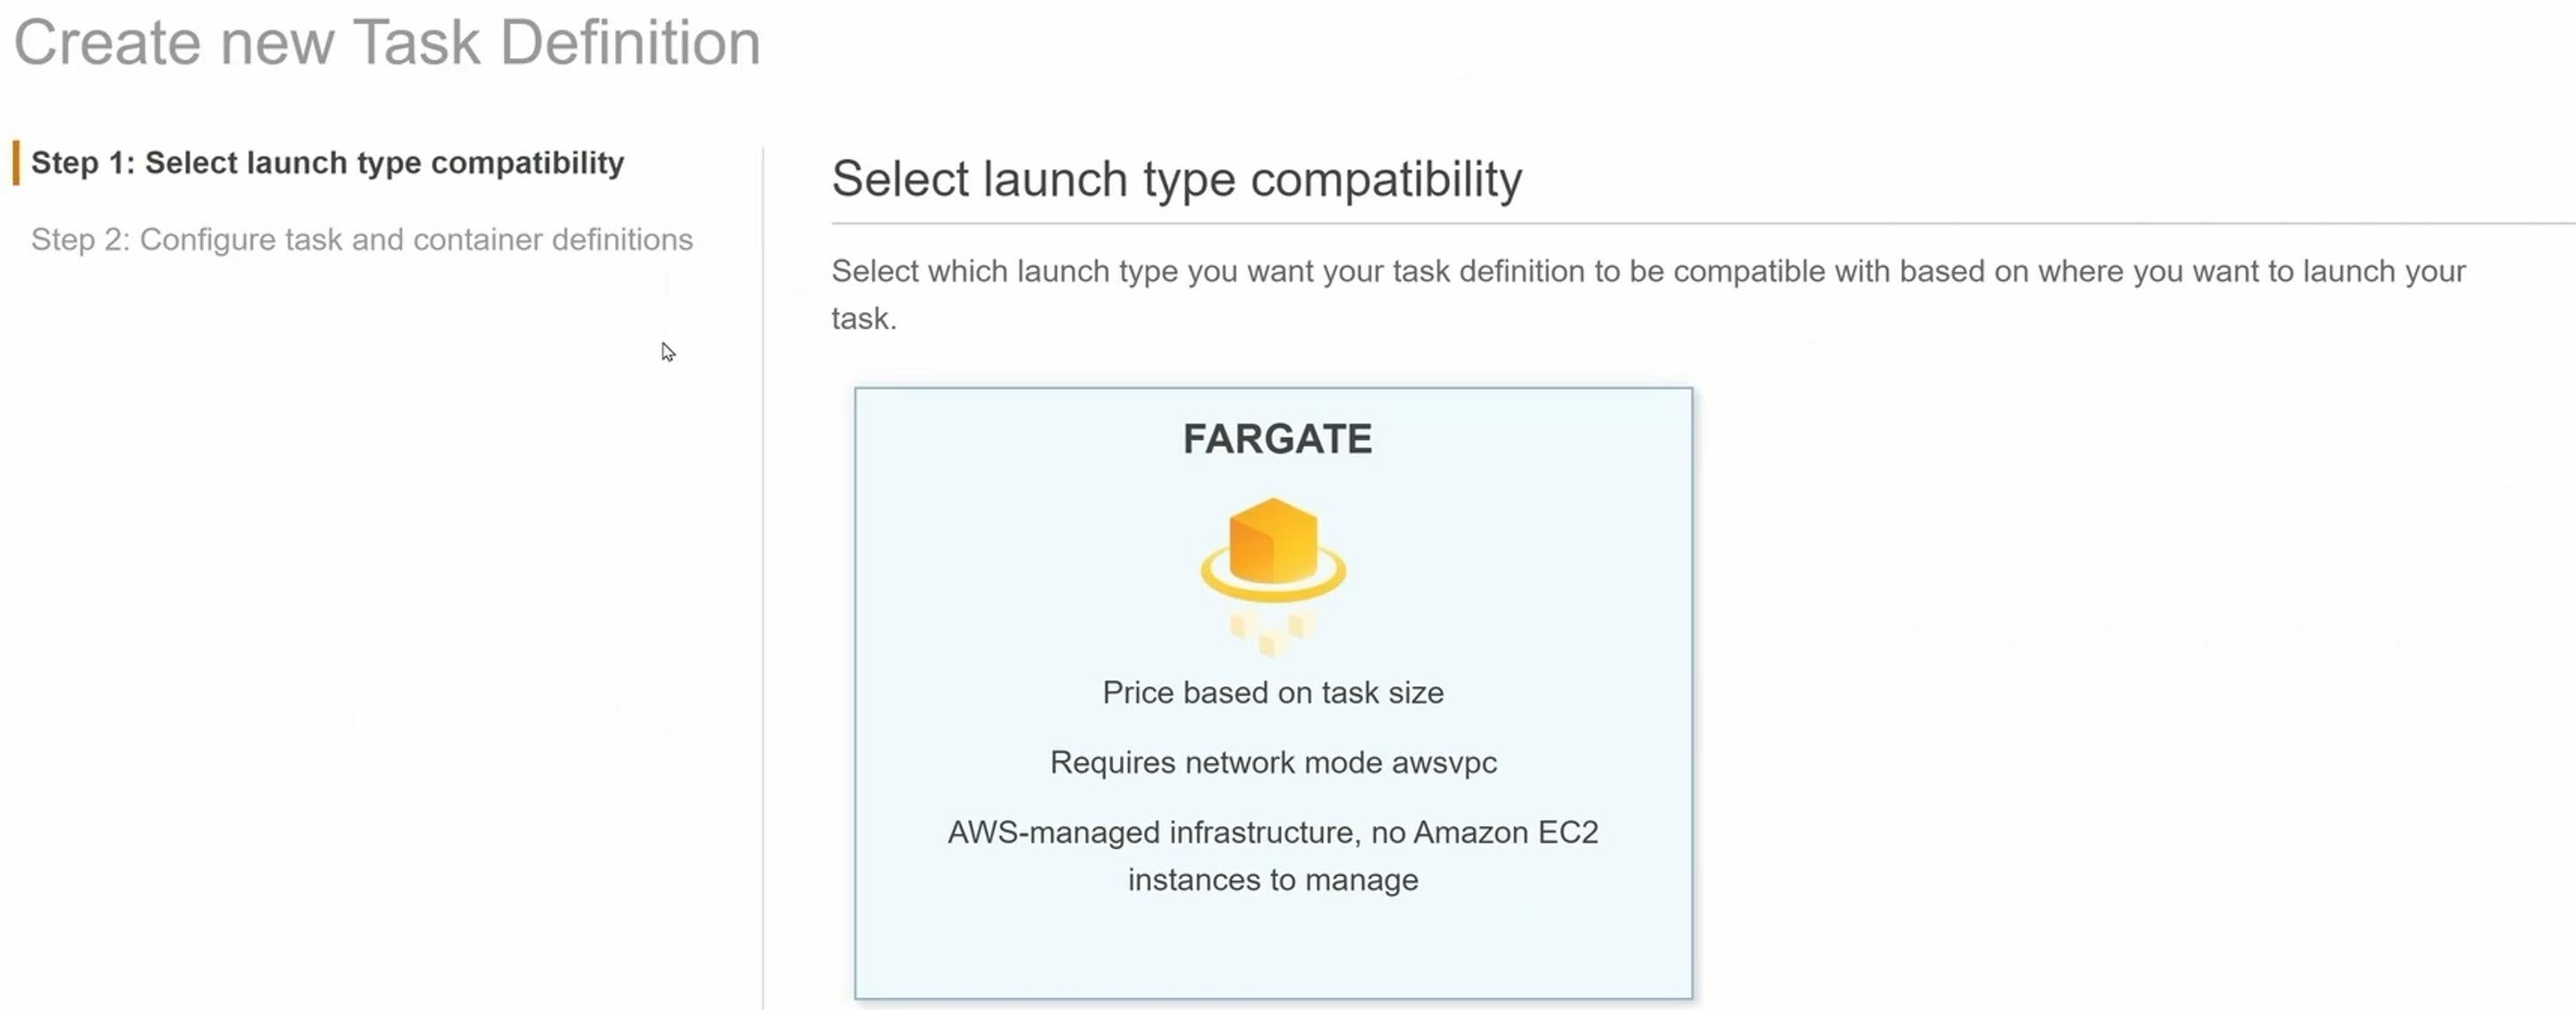
Configure your task and container definitions, adding the task definition name and the task role as below:
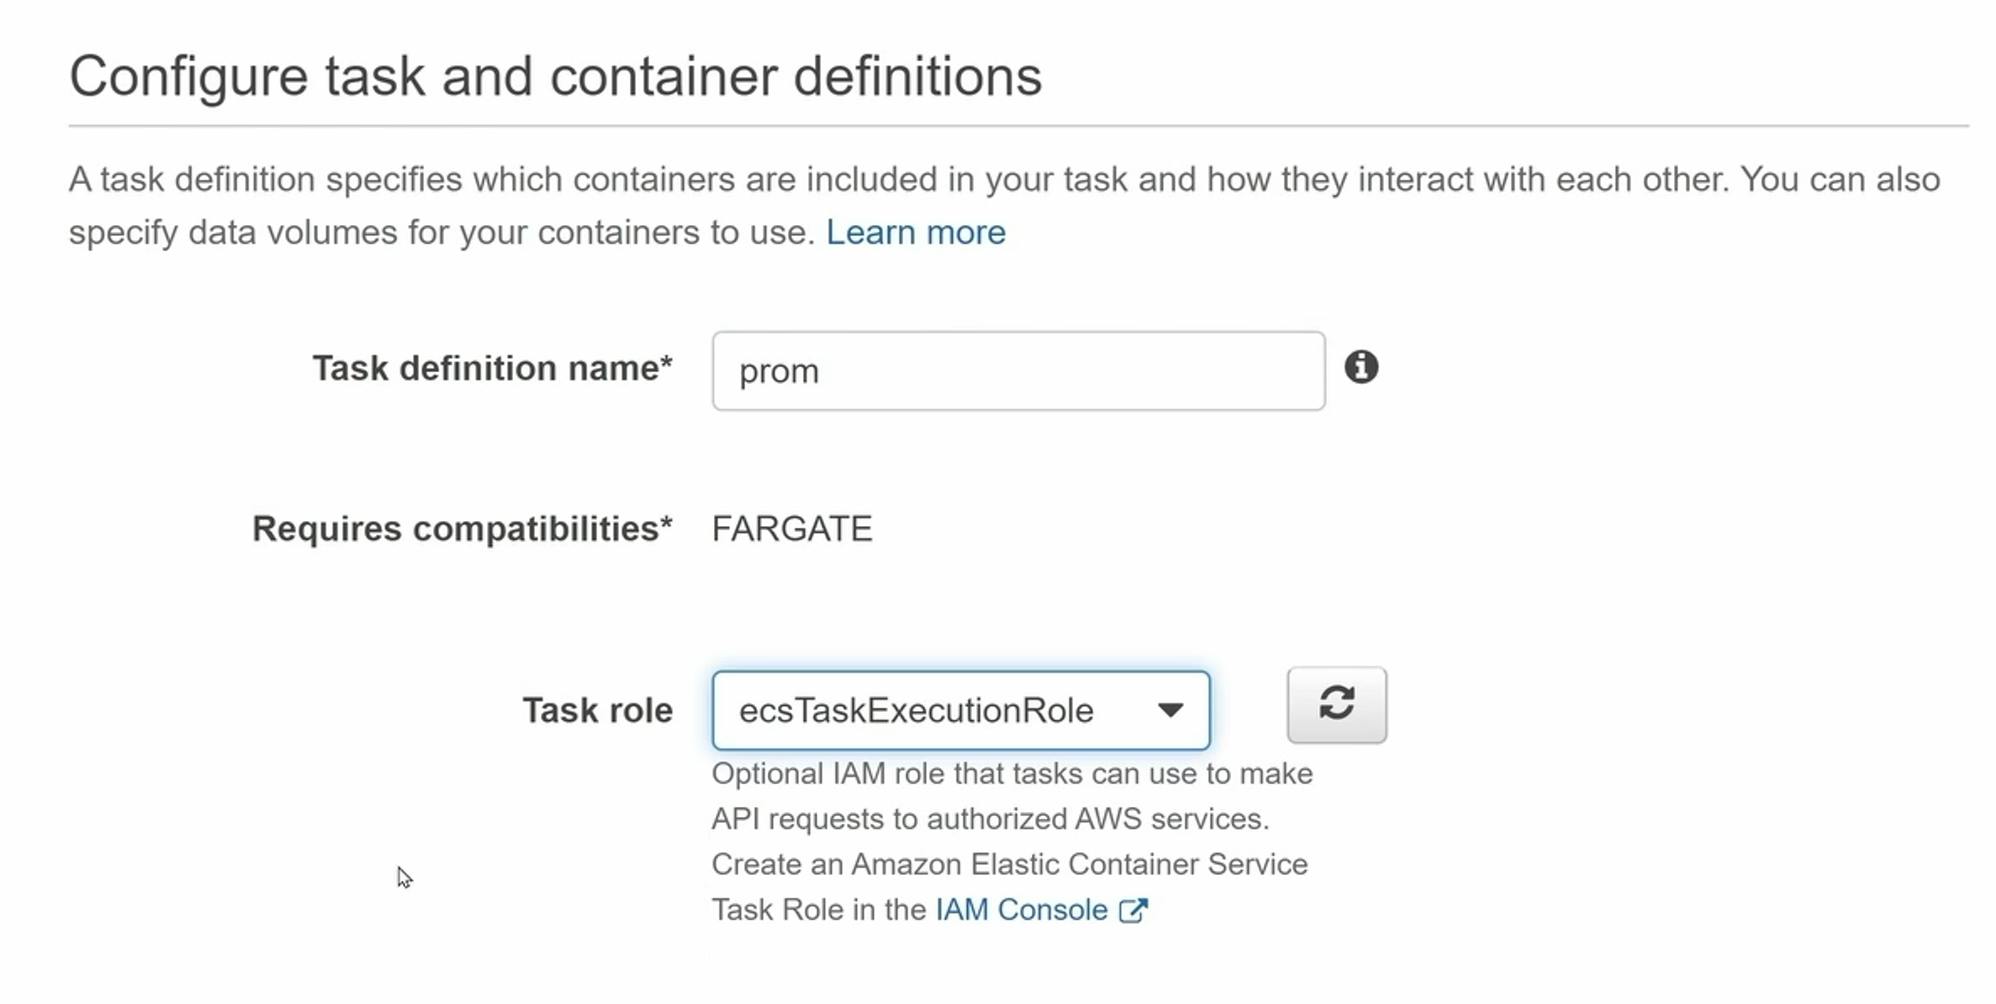
Define Memory and CPU (you can use the lowest ones)

Finally, click Add container:

Add the container name and the URL to the container image (note that I’ve whited out the AWS account ID in this image for security purposes):
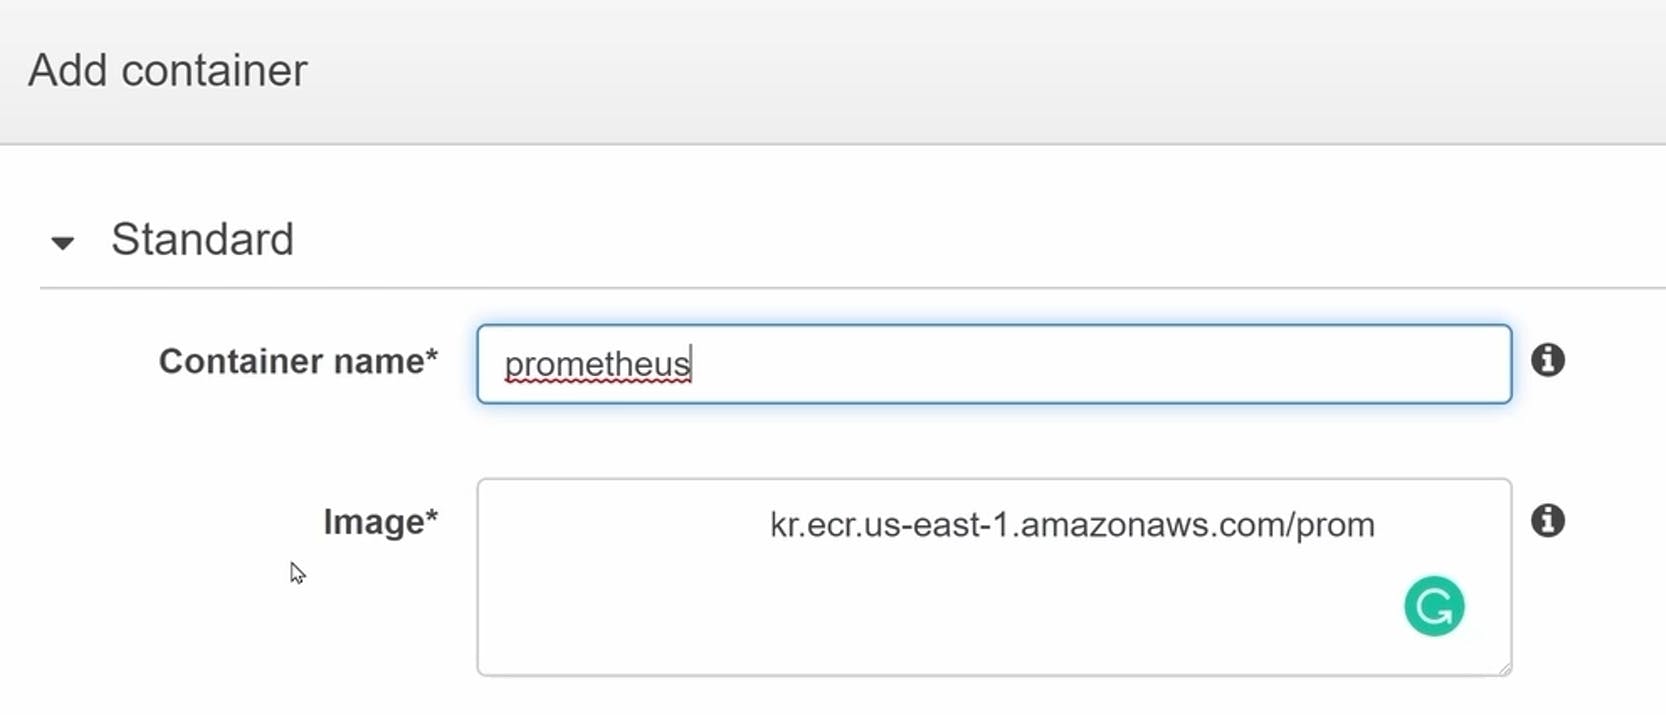
For port, use 9090, the default port of the official Prometheus image:

Leave everything else as it is, and click *Add
In Clusters, click on the cluster's name (in our example, prom-node)
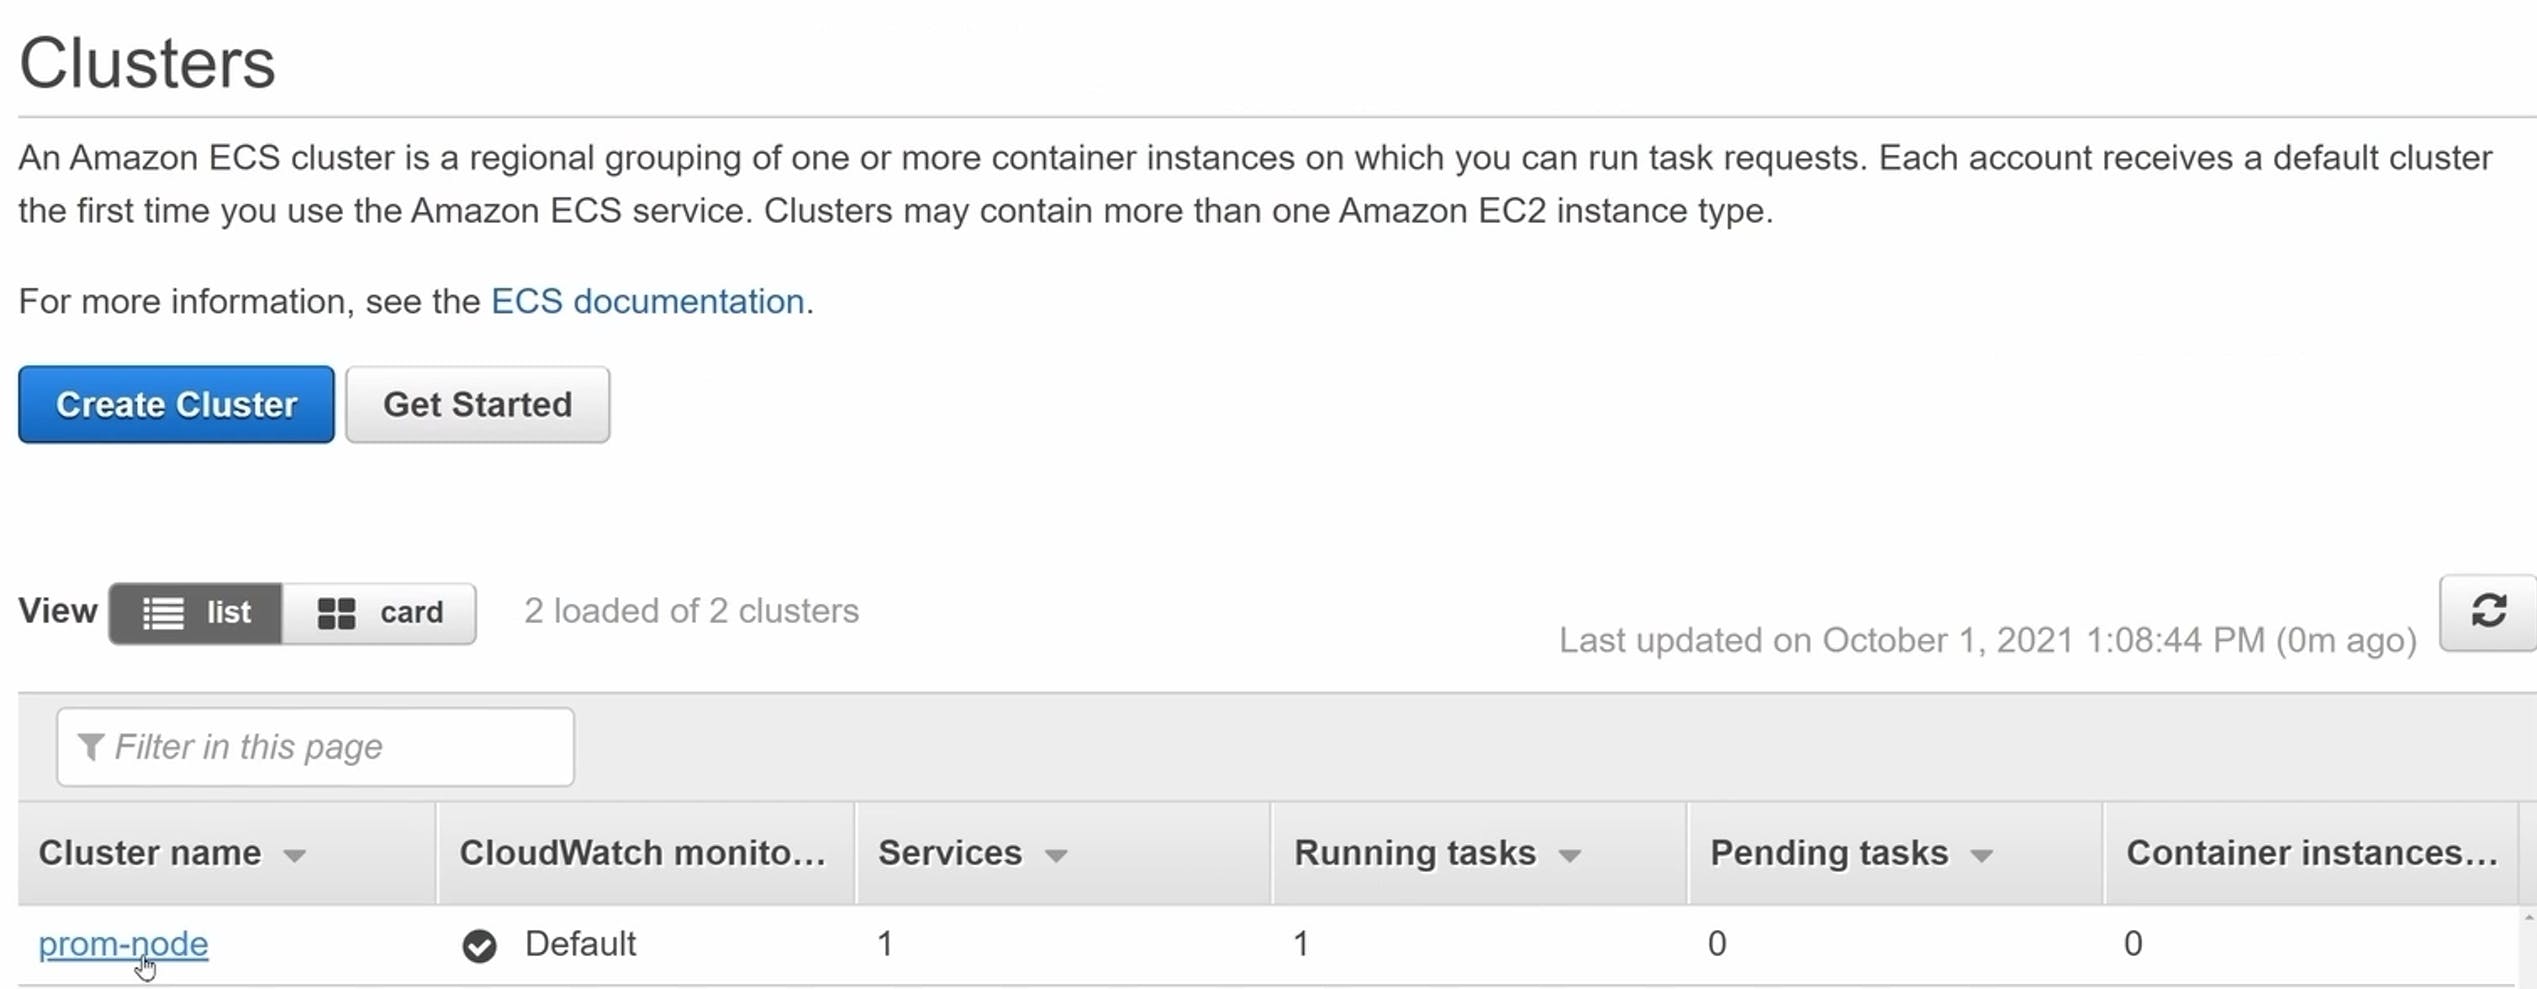
Next, click on Run New Task:
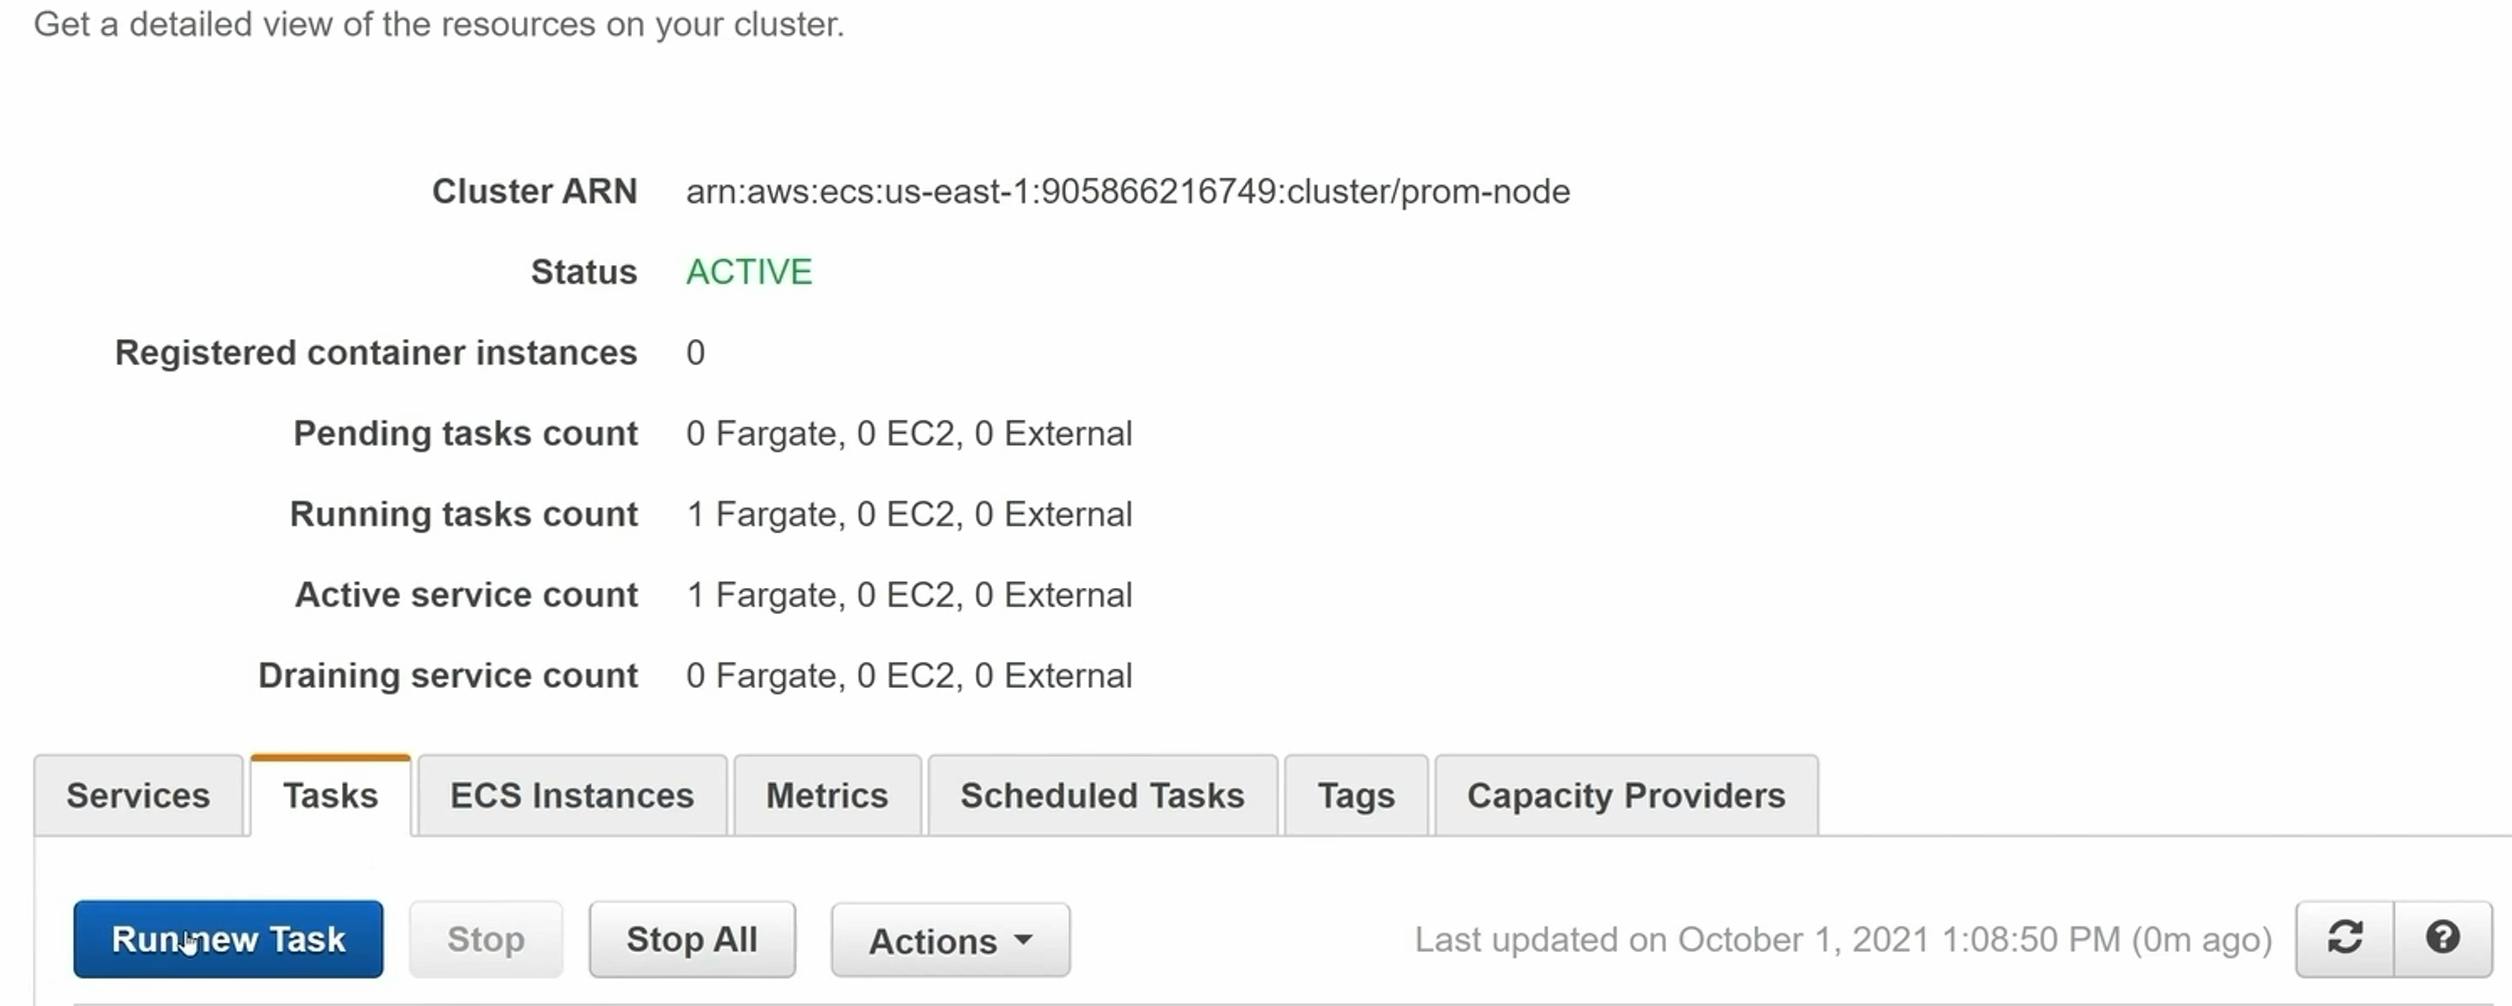
In Run Task, define:
- LaunchType:
Fargate - Task definition:
prom(or the name you have defined)
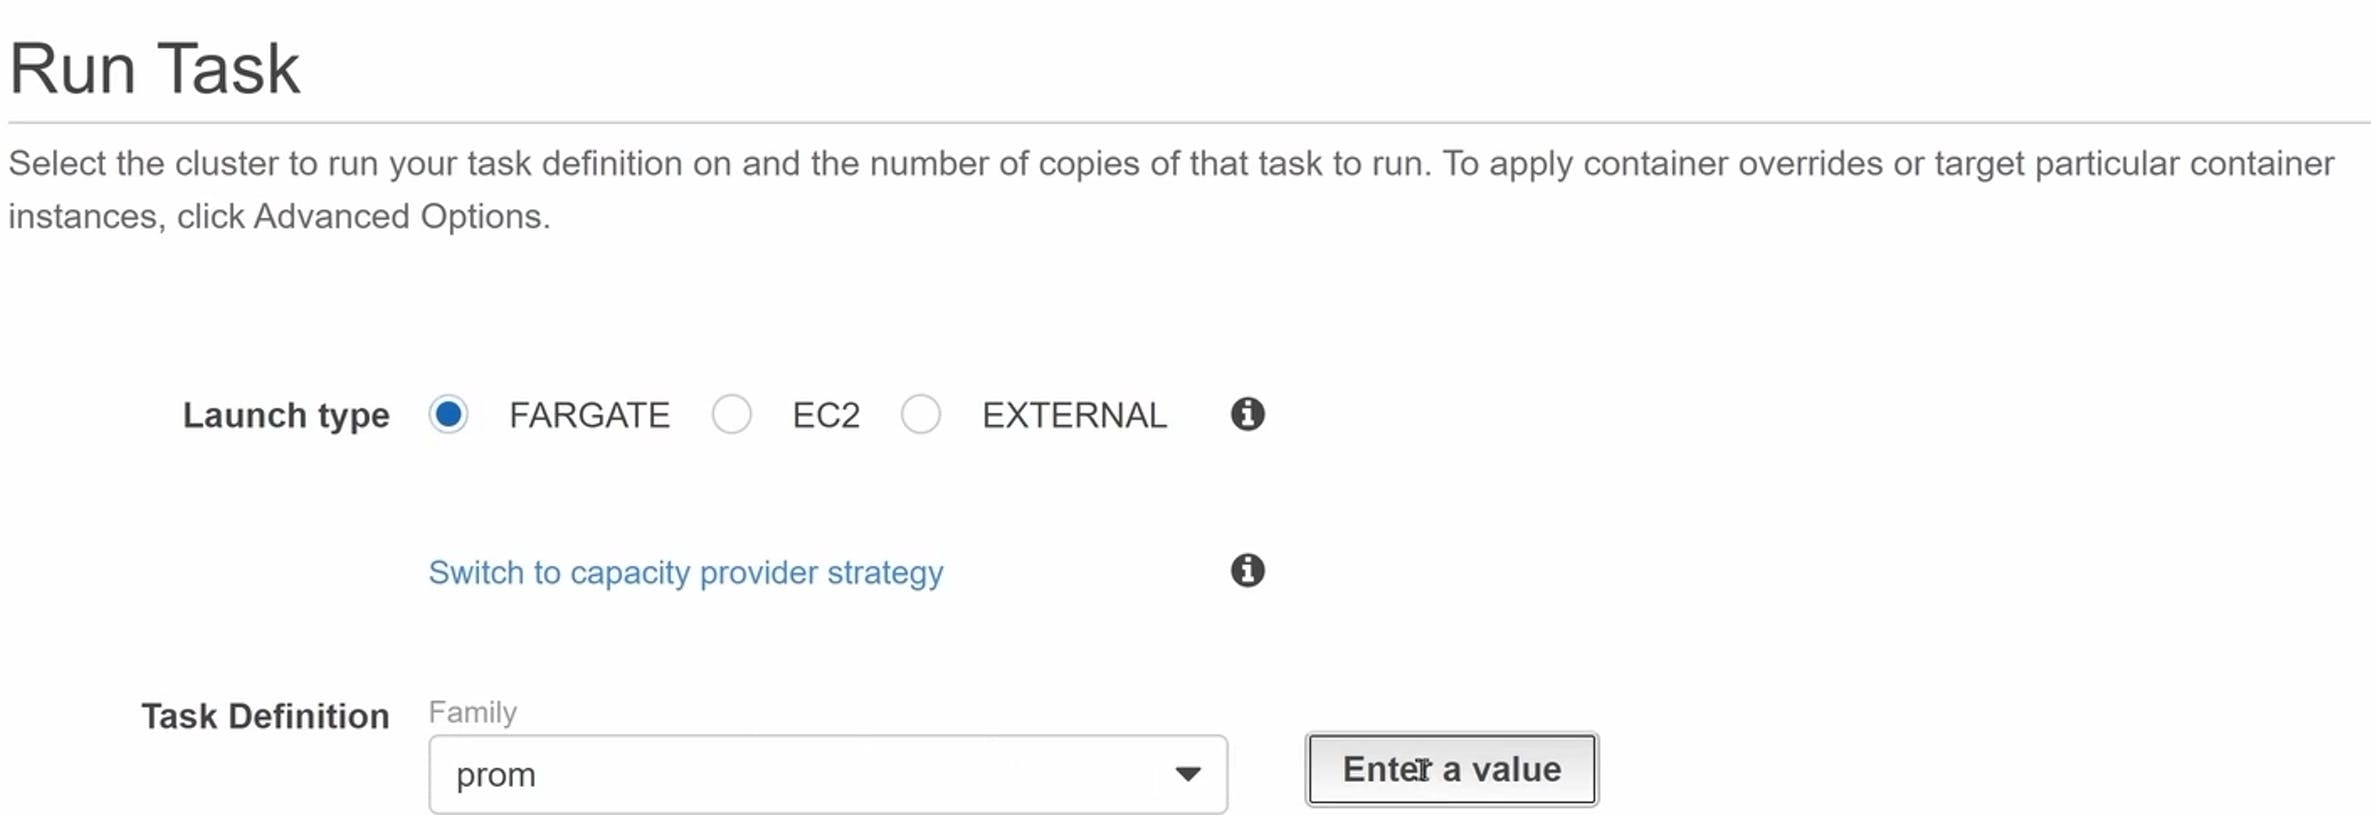
Define a subnet:

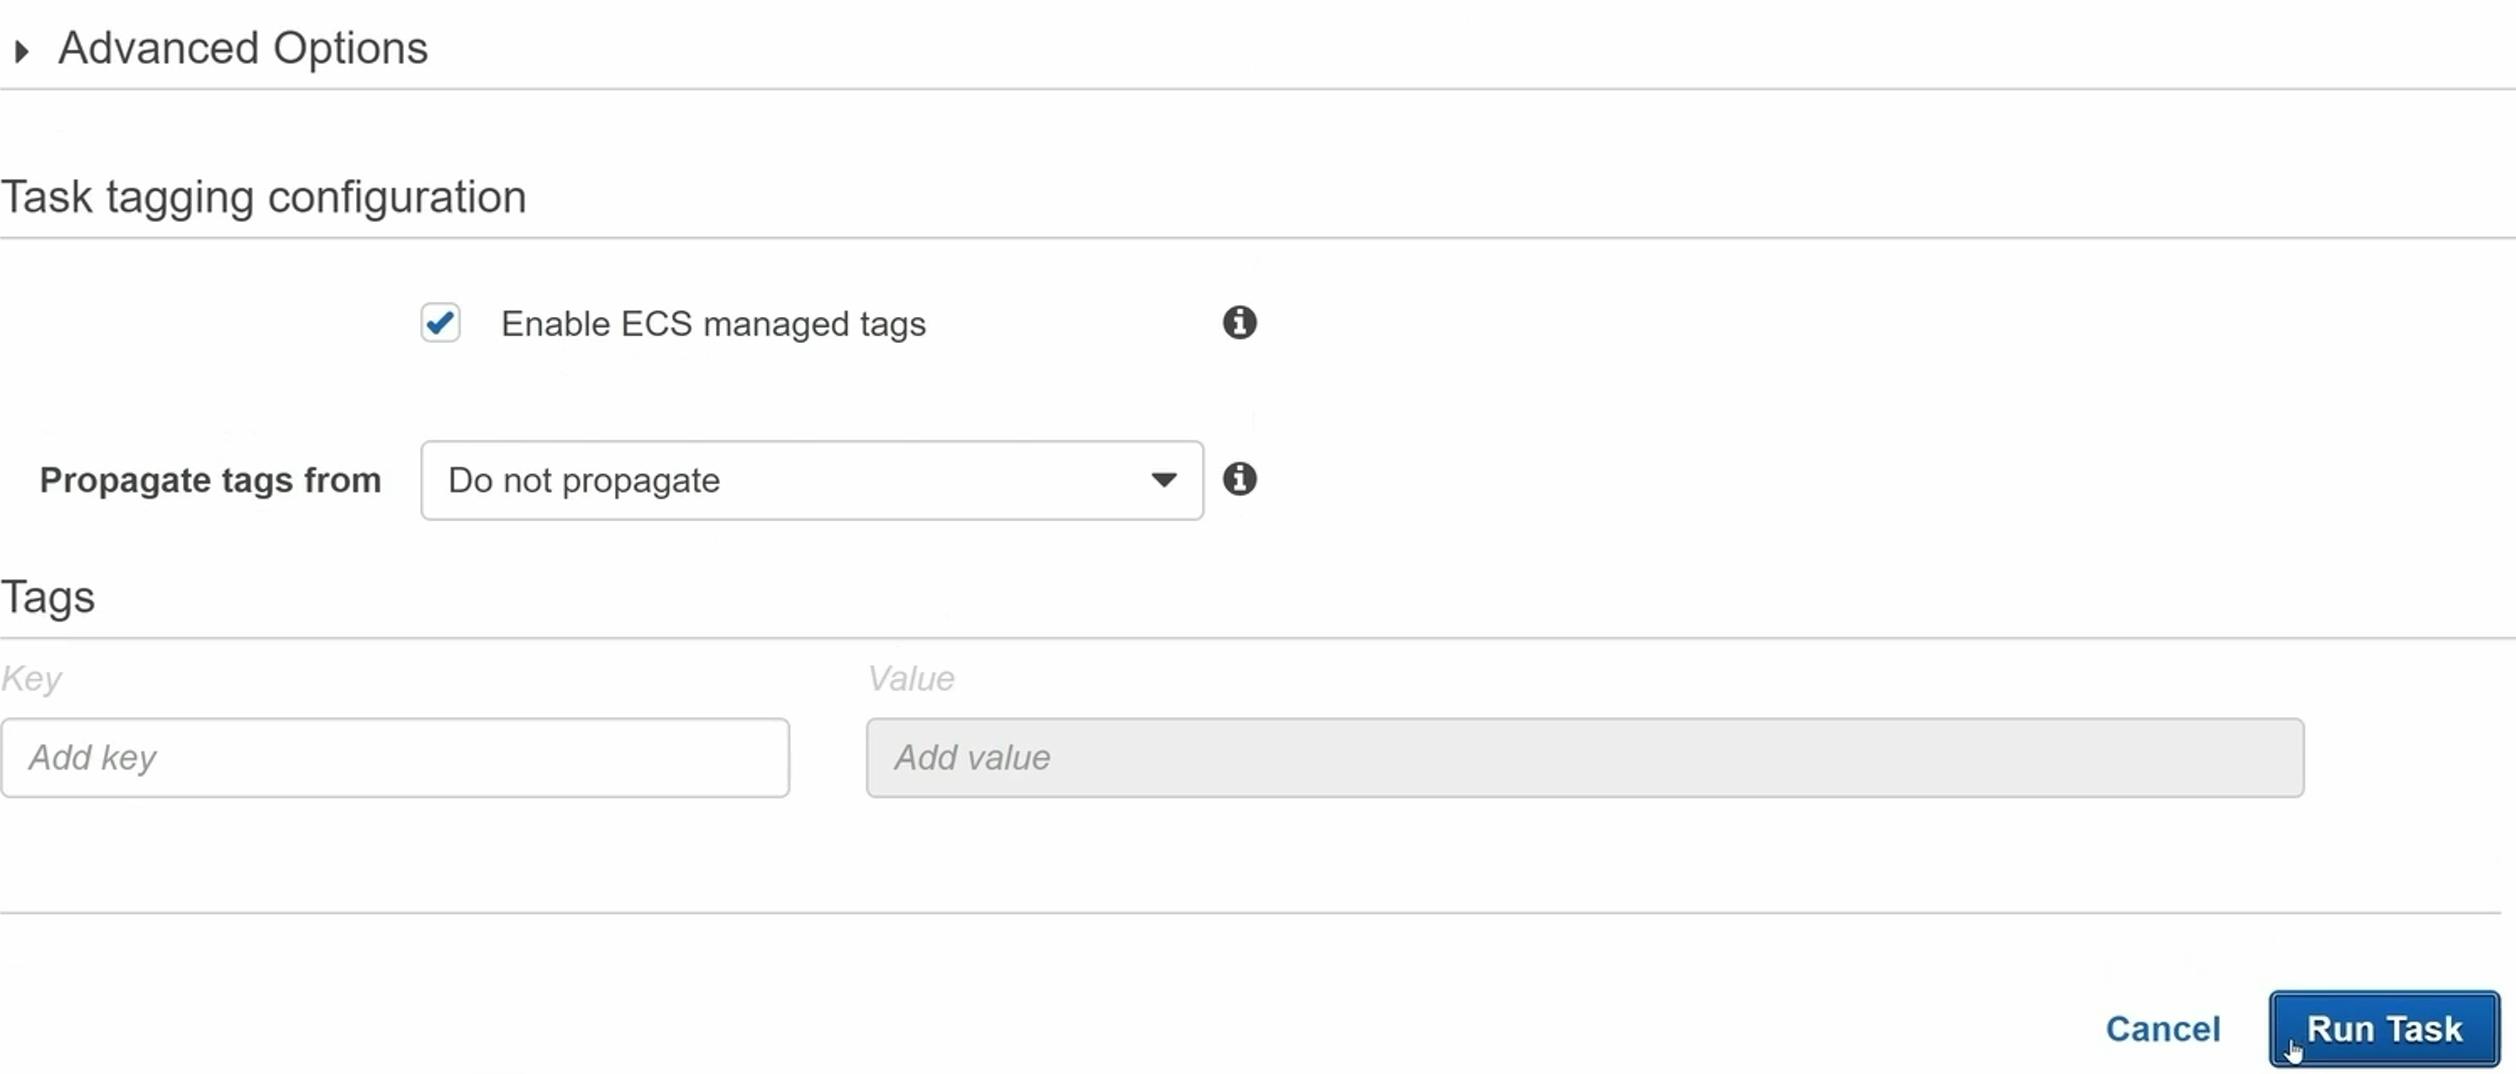
Then click on Run Task:
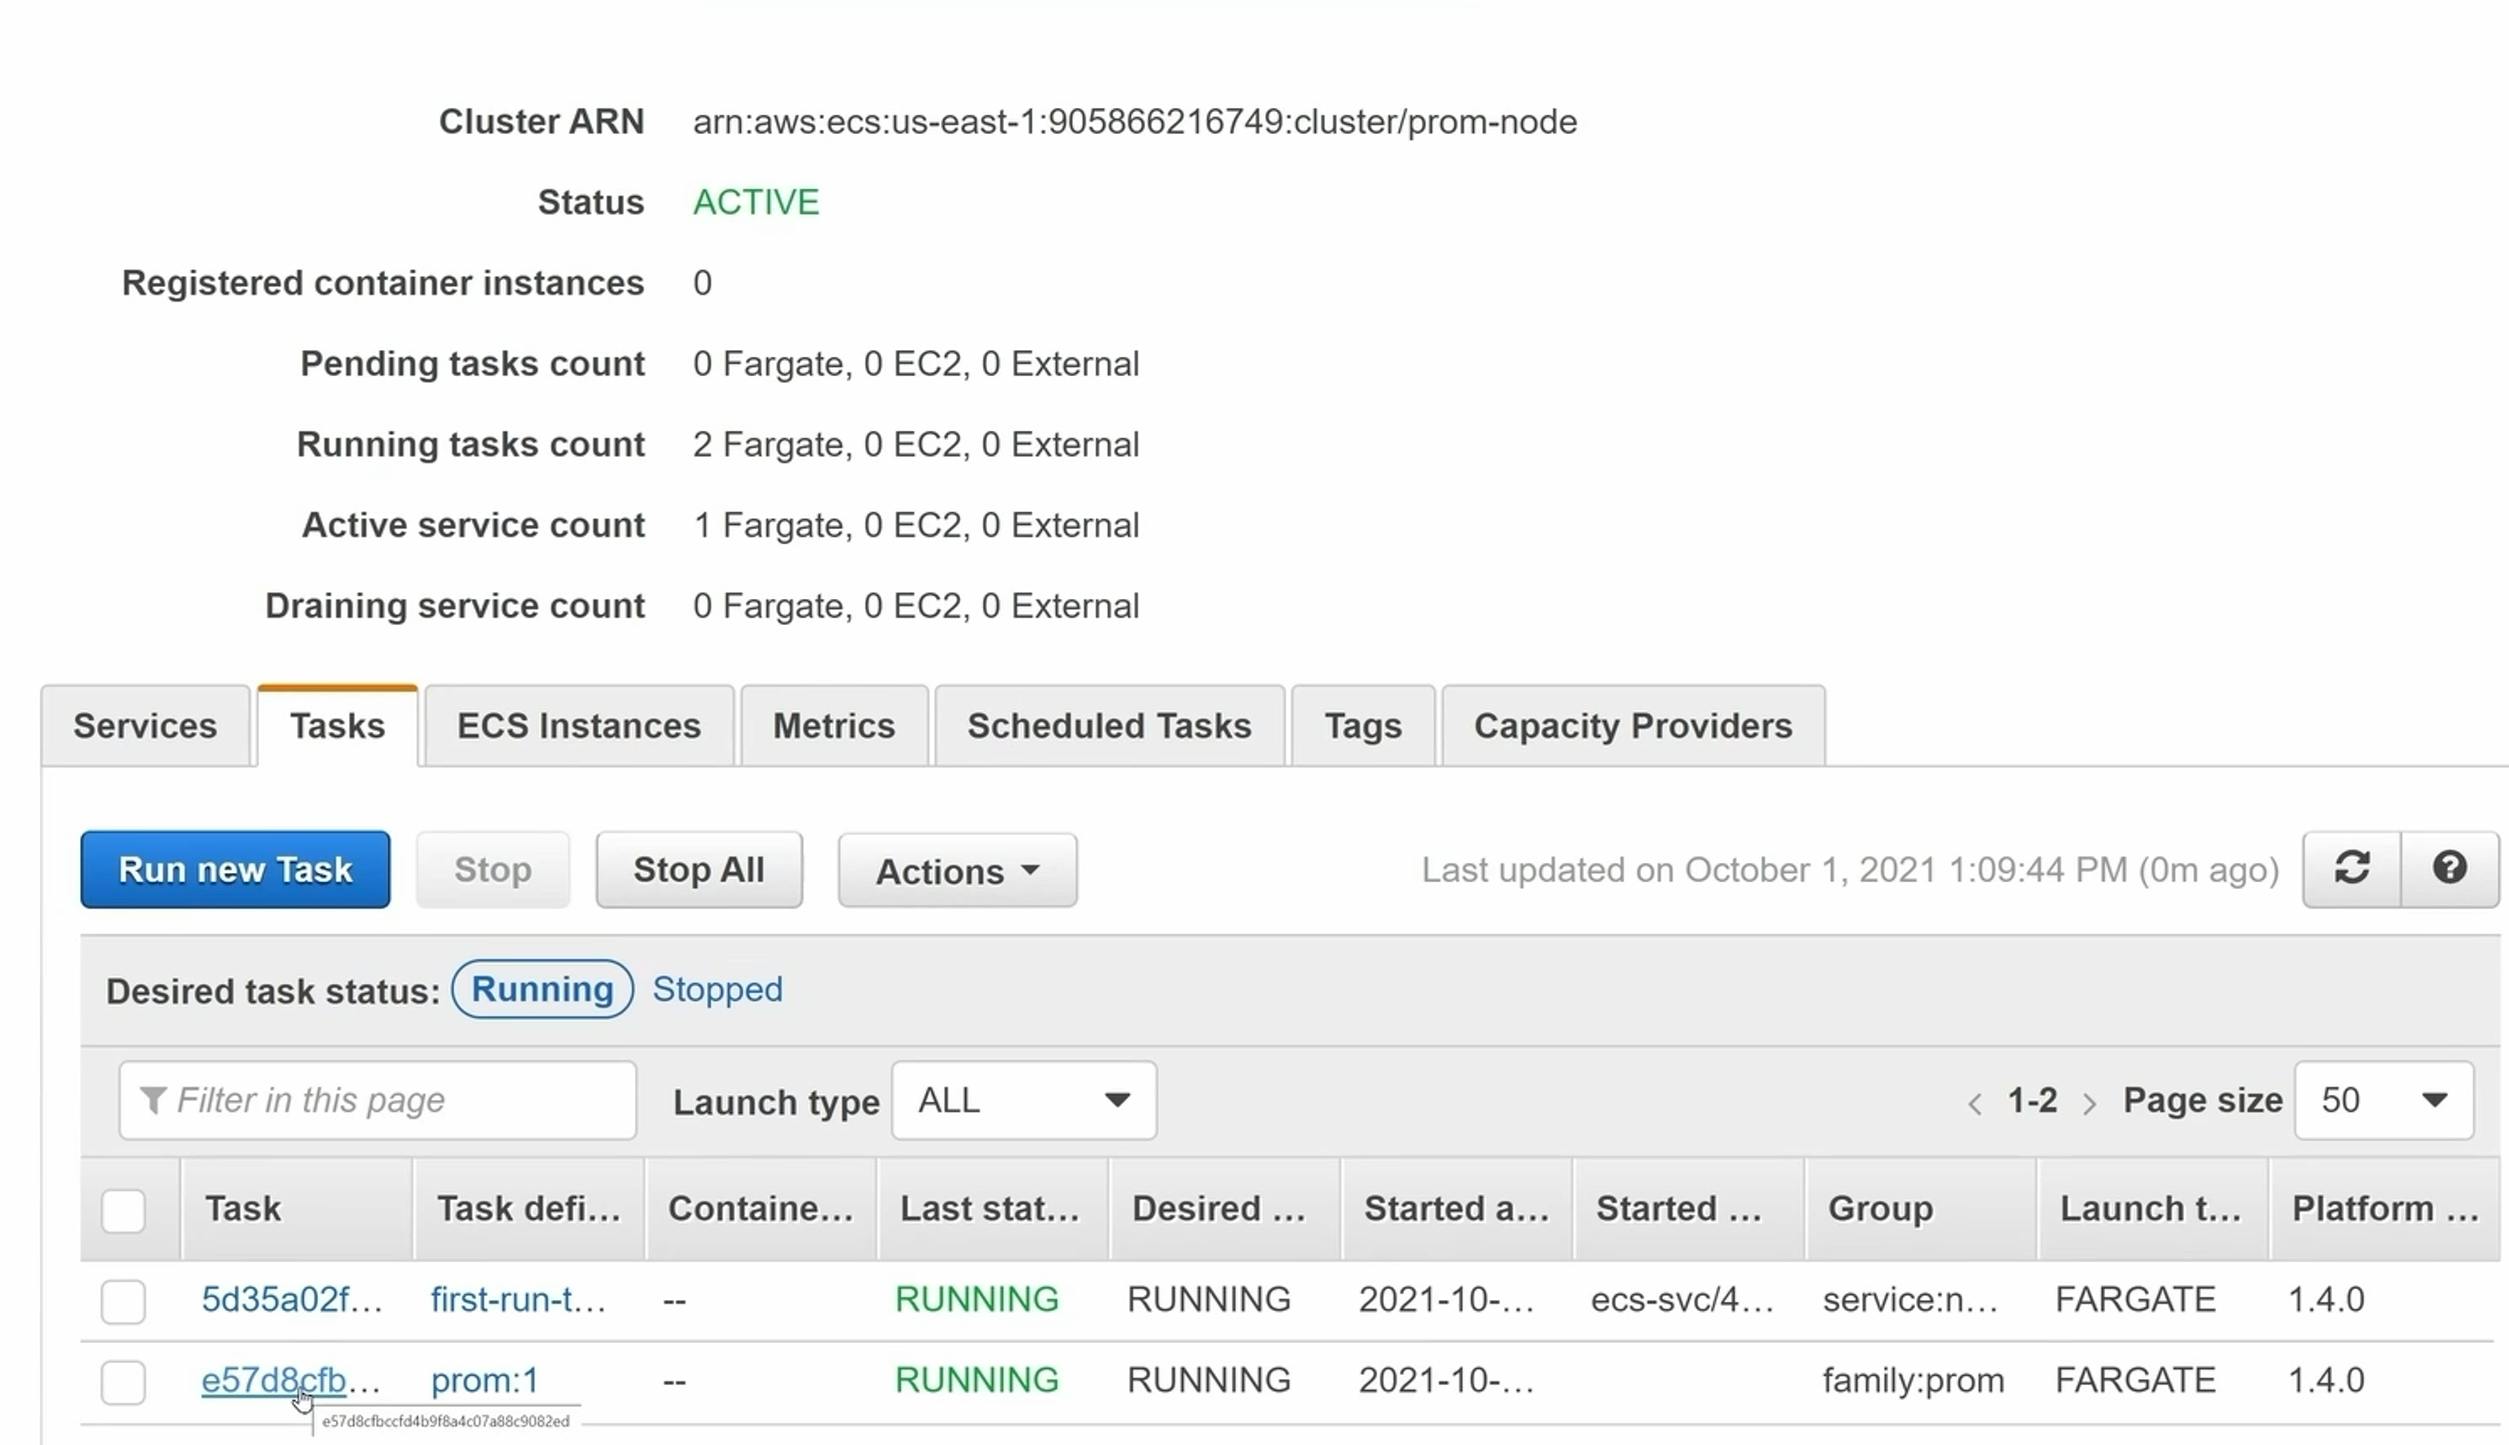
Go on the cluster again and you will see two running tasks (wait for the one you just defined to transition to RUNNING):
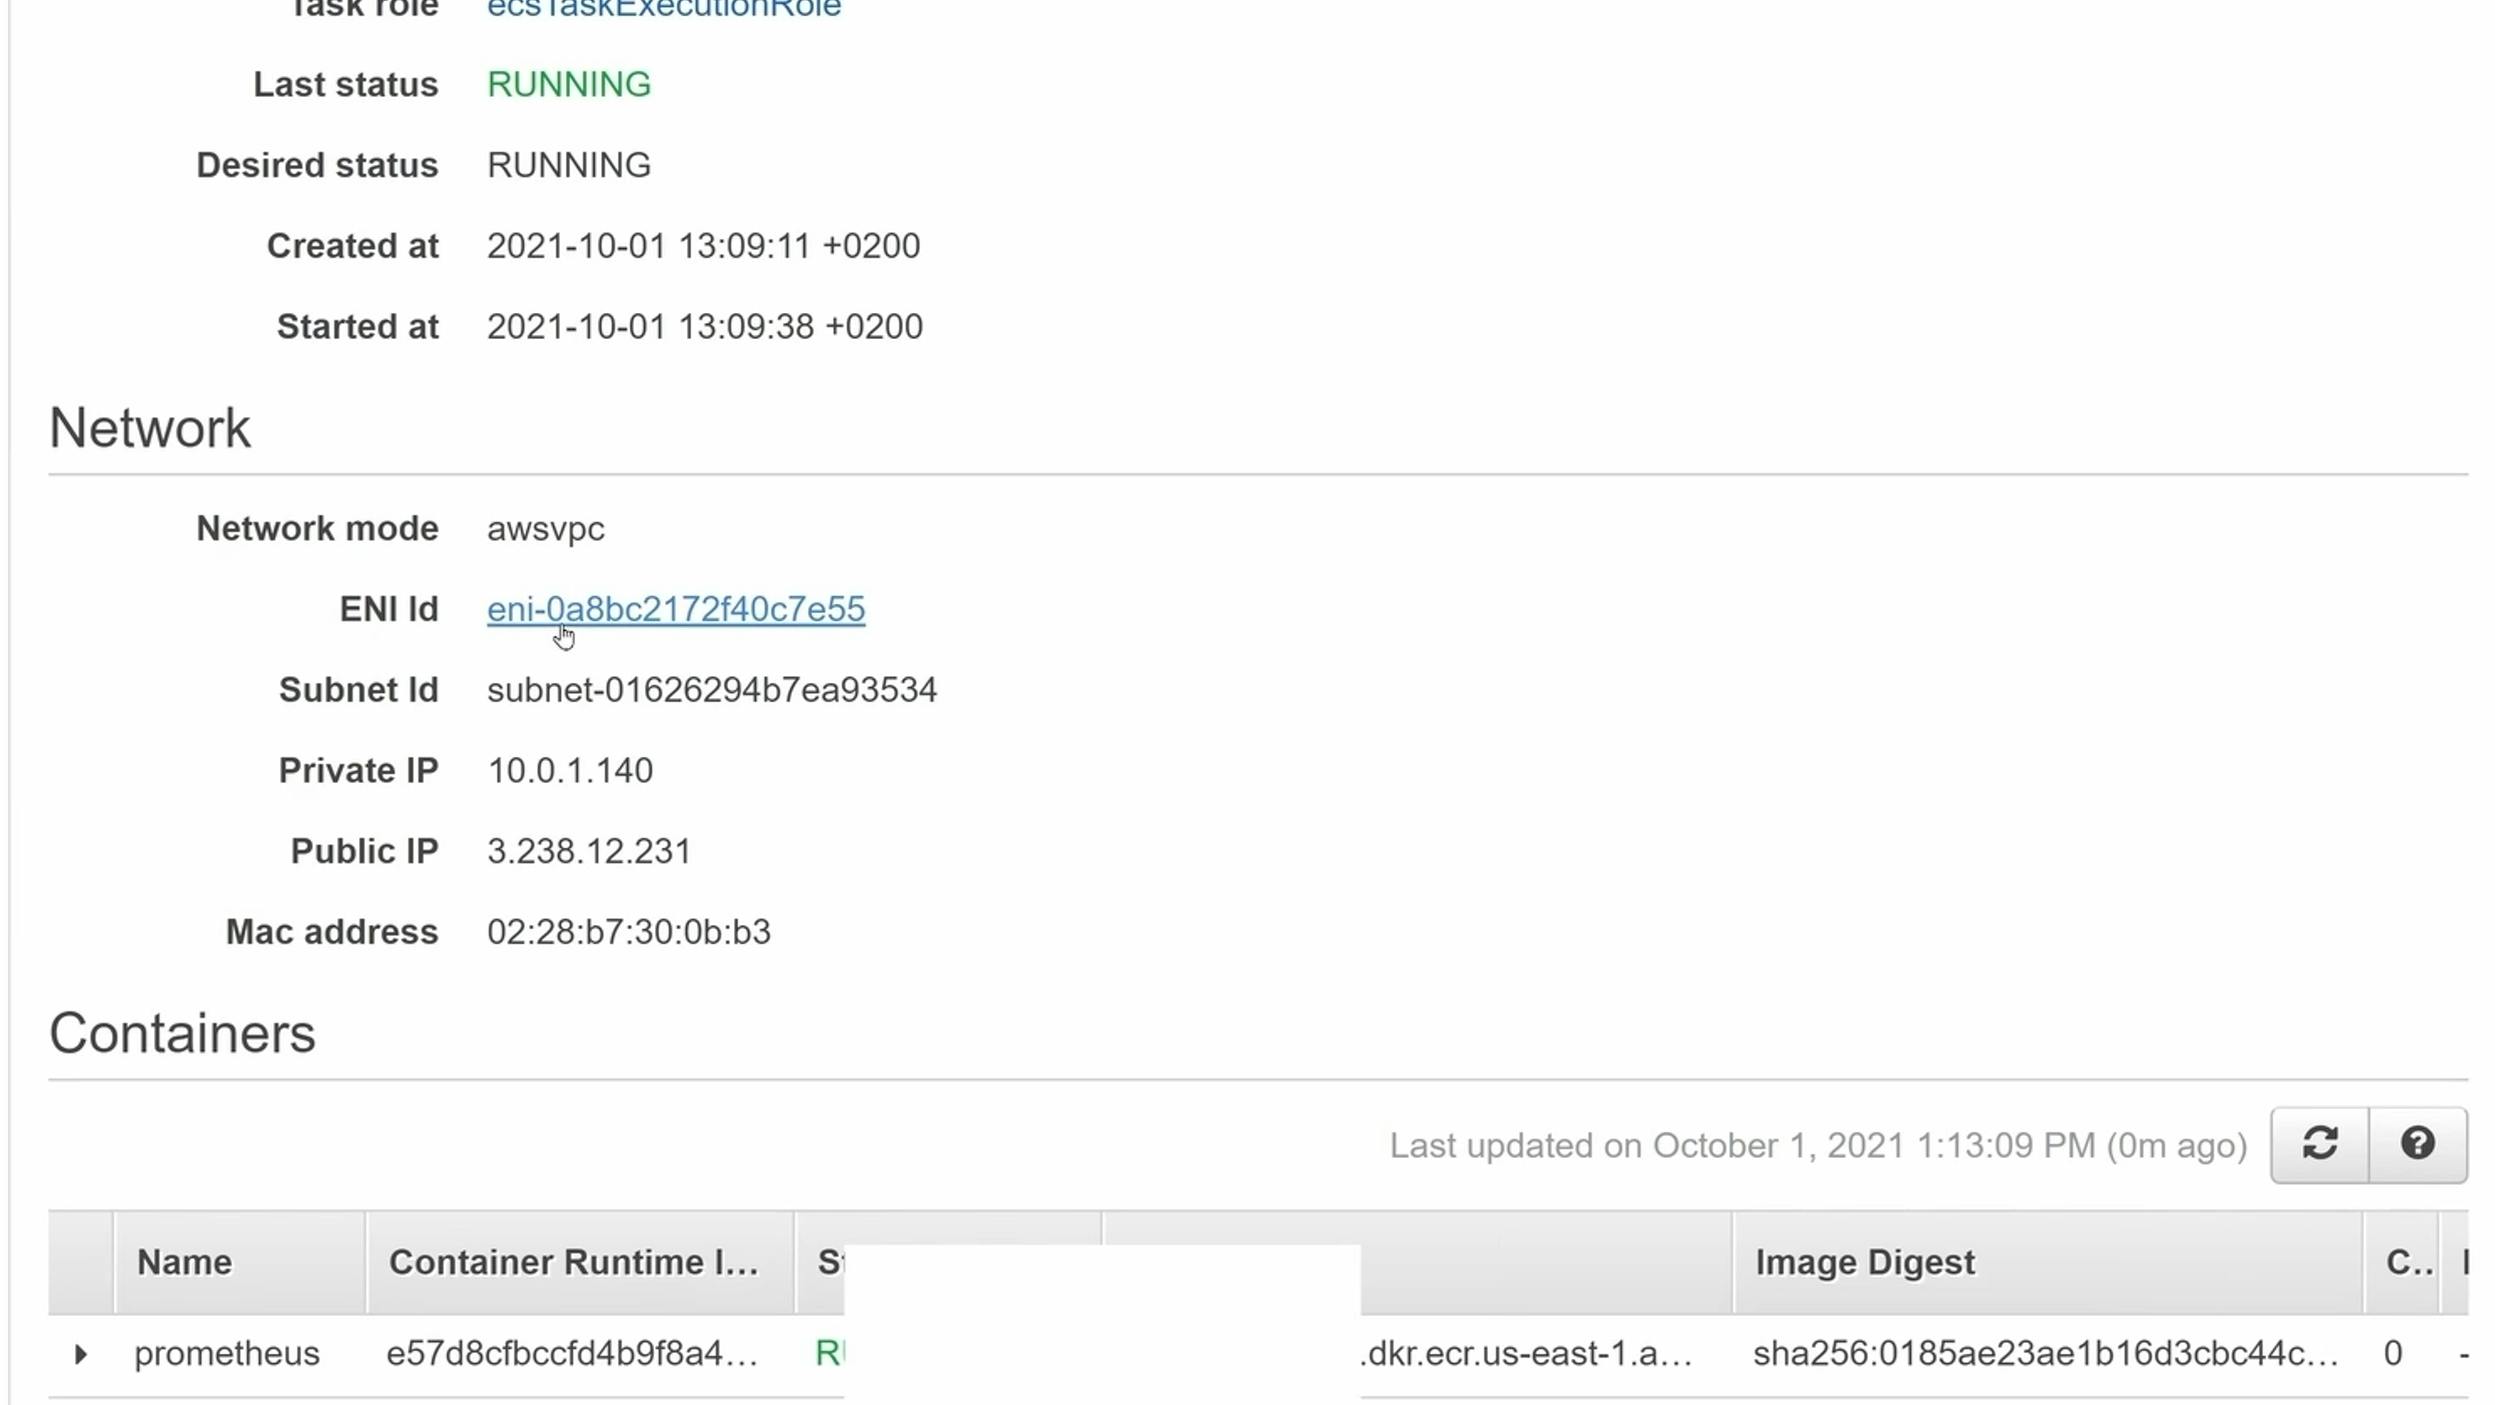
Change Security Group Inbound Rules
Before the final test, be sure that the inbound rules of this task are set up properly. Click on the ENI ID:
On the Network interface, click on the security group:

Click on Edit Inbound Rules and ensure that this task is accessible from the outside:

Final Test
Visit the public IP address of the second service we deployed (the Prometheus one):
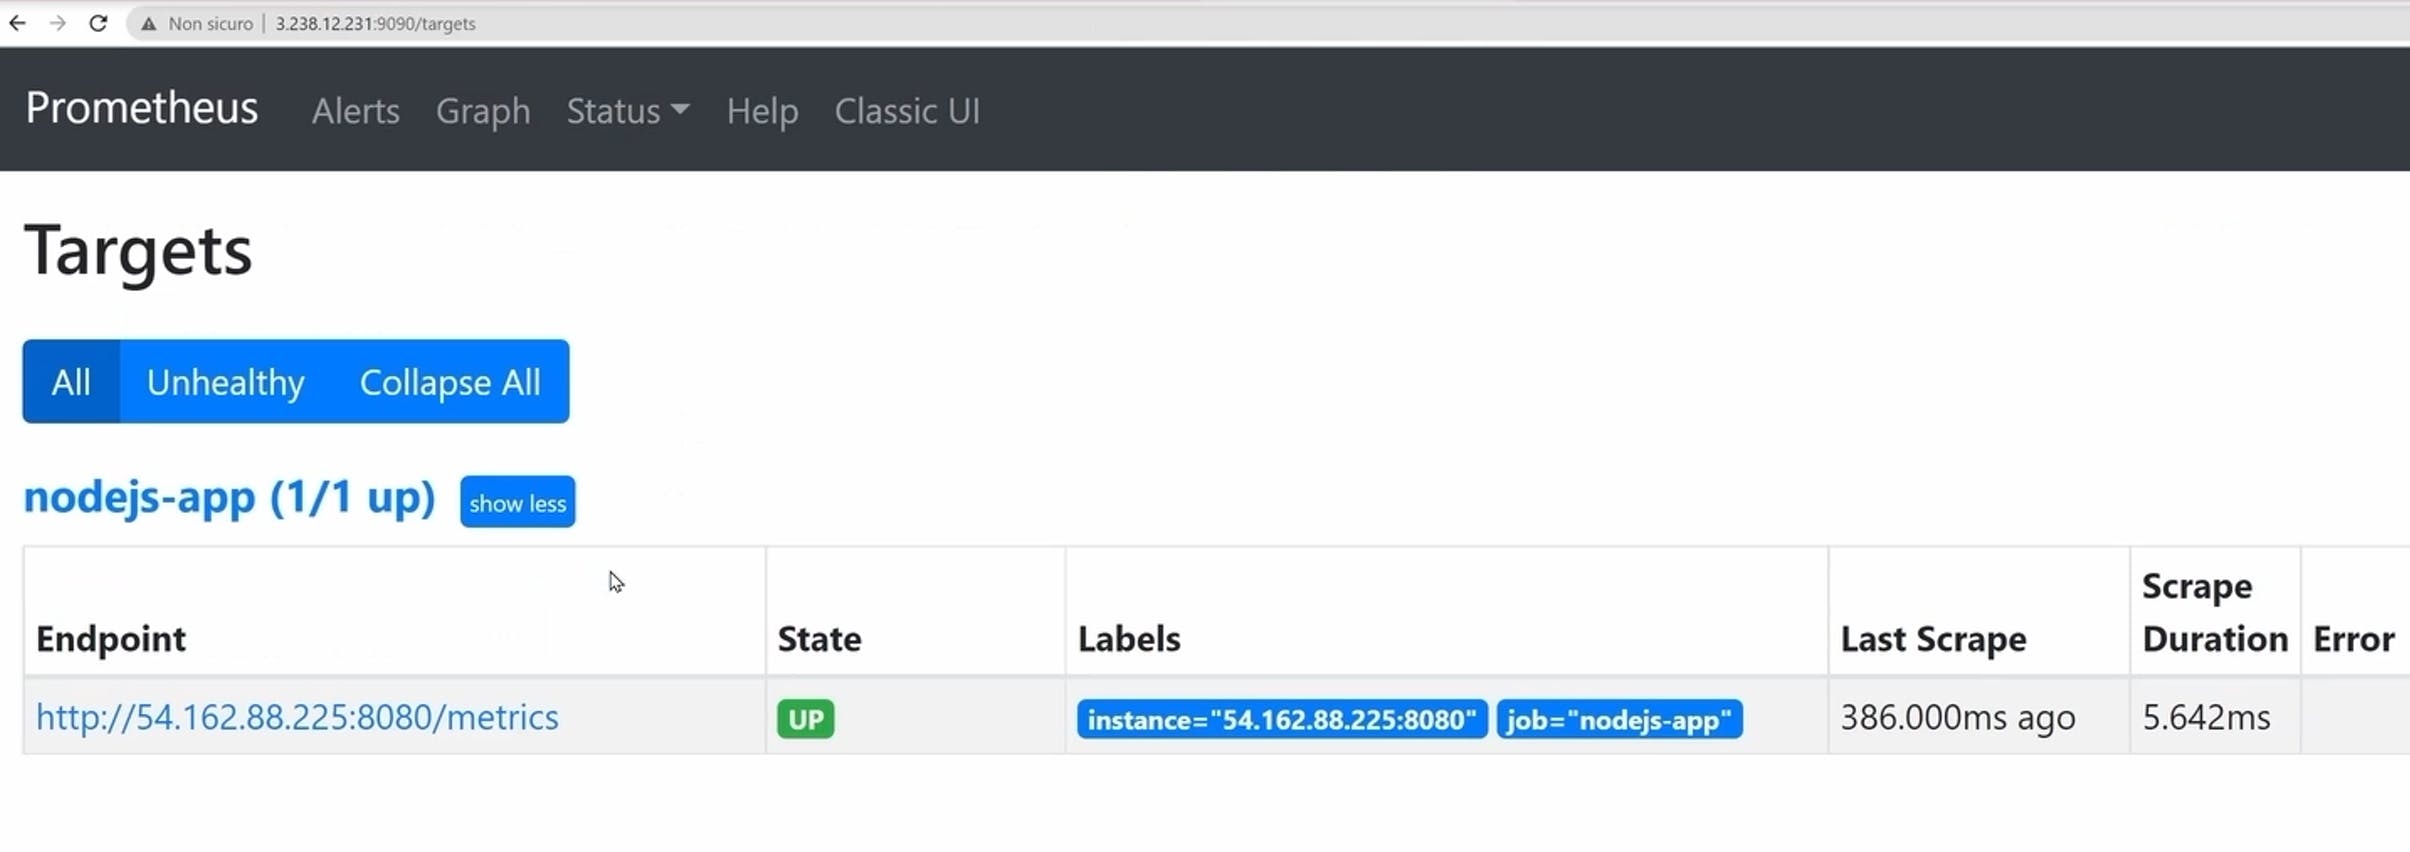
As you can see, the Prometheus application is linked to the Node.js app deployed on the Node.js app IP address. Success!

